
Figure 5.
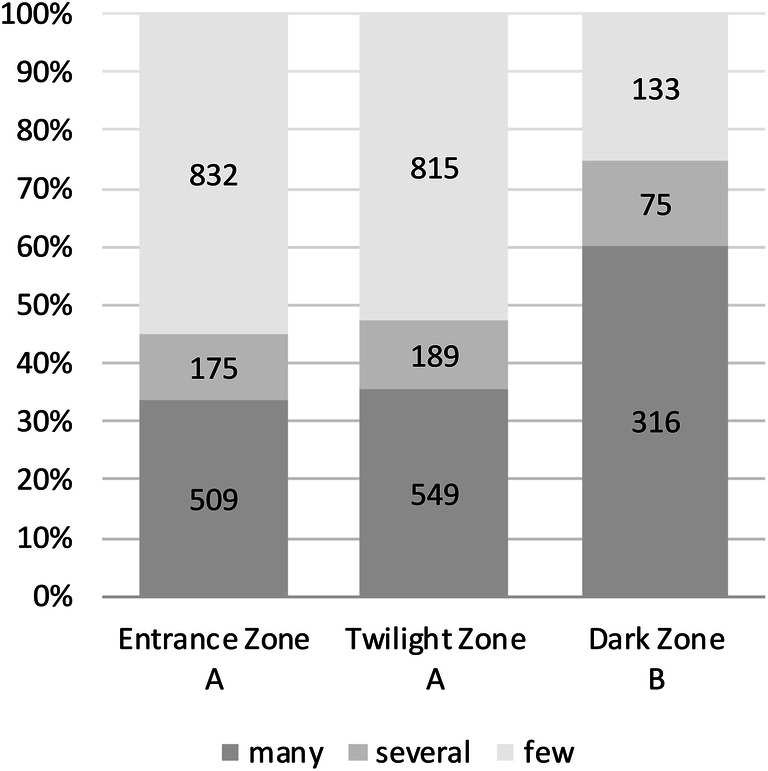
Comparison of mosquito abundance of the different depth zones within cavernous habitats during the hibernation period. Statistical significance is symbolized with A and B, where non-matching letters are significantly different (Chi Square: 154.3, 4 df, p < 0.0001; corrected value A against B: p < 0.0001). Y-Axis: composition of categories within the sampling. The numbers in the bar graphs show the absolute frequency of categories in the respective years. Categories: many: > 20 individuals, several: 10–20 individuals, few: 1–10 individuals found within the cave.