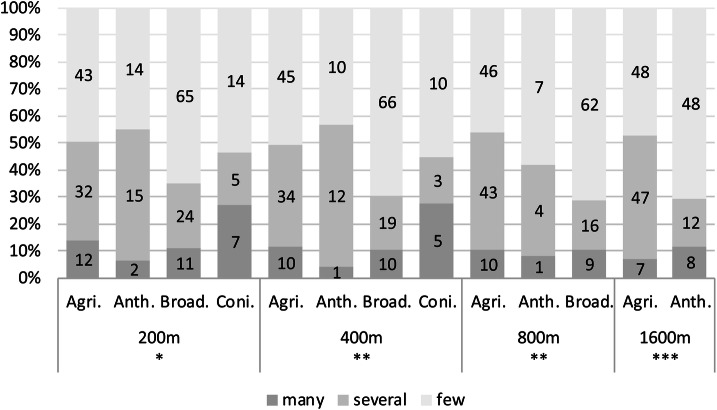
Figure 6.
Comparison of mosquito abundance and different main land cover categories surrounding hibernacles in four different radiuses during the hibernation period. Abbreviations: Agri., agriculture and pastures; Anth., anthropogenic and urban; Broad., broadleaved forest; Coni., coniferous forest. p-values and Chi square statistics: 200 m: 0.02, 14.67, 6 df, Anth. against Coni.: 0.03, Anth. against Broad.: 0.03; 400 m: 0.004, 18.99, 6 df, Anth against Coni: 0.02, Anth. against Broad.: 0.007, Agri. against Broad.: 0.01; 800 m: 0.007, 14.8, 4 df, Agri. against Broad.: 0.007; 1600 m: 0.0007, 14.61, 2 df, Agri against Anth.: 0.0007. Omitted data from adjusted sample set of 263 sampling points: 200 m: 7%, 400 m: 14%, 800 m: 25%, 1600 m: 35%. Y-Axis: composition of categories within the sampling. The numbers in the bar graphs show the absolute frequency of categories in the respective years. Categories: many: > 20 individuals, several: 10–20 individuals, few: 1–10 individuals found within the subterranean shelter.

