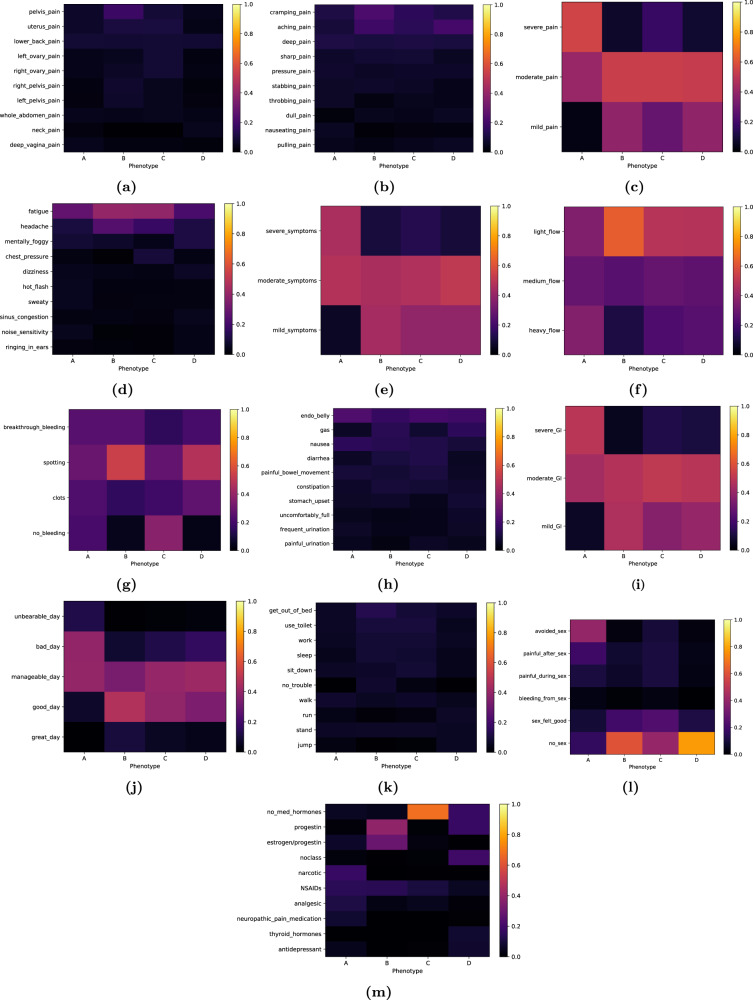
Fig. 2. Visualization of learned posteriors for endometriosis phenotypes.
Each phenotype is defined as a set of per-question probability distributions across the answers to each of the thirteen questions. Each heatmap represents the likelihood of the answers within a question for a given phenotype—for visual clarity, only the top 10 (most likely) vocabulary items of the posterior are displayed. a Where is the pain? b Describe the pain. c How severe is the pain? d What are you experiencing? e How severe is the symptom? f Describe your period flow. g What kind of bleeding. h Describe GI/GU system. i How severe is it? j How was your day? k Activities difficult to perform. l Describe sex. m Medications/hormones taken. For instance, the “no_sex” answer is highly likely to be tracked under phenotype D, and not likely to be tracked under phenotype A—yellow versus purple respectively, in heatmap l.

