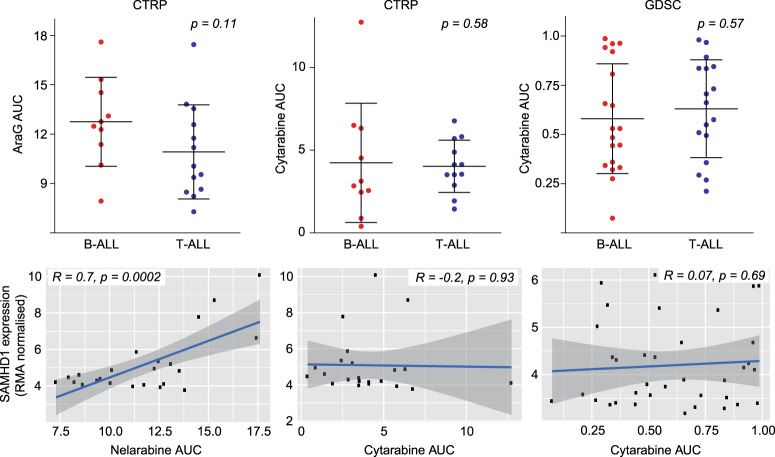
Fig. 2. Comparison of nelarabine (CTRP) and cytarabine (CTRP, GDSC) sensitivity between B-ALL and T-ALL cell lines and correlation of SAMHD1 mRNA levels with the nelarabine and cytarabine sensitivity (expressed as AUC) across all B-ALL and T-ALL cell lines.
Pearson’s r values and respective p-values are provided. Respective data on the correlation of SAMHD1 expression with drug sensitivity exclusively for B-ALL and T-ALL cell lines are provided in Supplementary Fig. 3 (nelarabine) and Supplementary Fig. 4 (cytarabine).

