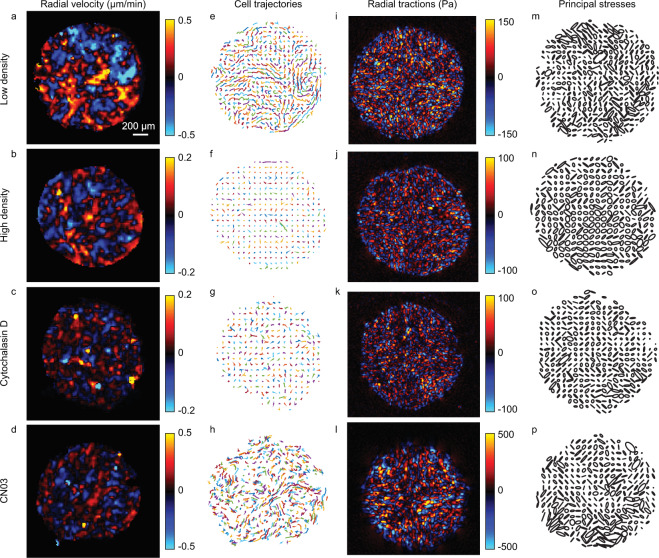
Fig. 2.
Representative plots showing velocities, trajectories, tractions, and stresses. (a–d) Radial component of cell velocities. (e–h) Cell trajectories. (l–l) Radial component of cell-substrate tractions. (m–p) Monolayer stress ellipses. Rows correspond to an island of low density (a,e,i,m), an island of high density (b,f,j,n), an island treated with cytochalasin D (c,g,k,o), and an island treated with CN03 (d,h,l,p).

