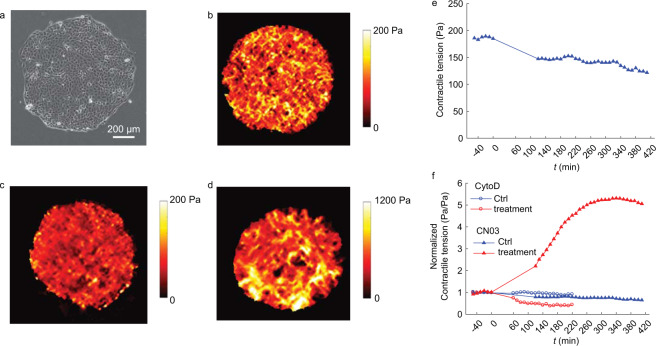
Fig. 3.
Technical validation of monolayer stresses. (a) Image of a representative cell island. (b–d) Colormaps of contractile tension for a control island (b), an island treated with cytochalasin D (c), and an island treated with CN03 (d). (e) Average contractile tension of a control island over time. Time t = 0 corresponds to the time that a treatment (in this case, vehicle control for CN03) is added. (f) Contractile tension is normalized by the average contractile tension for t < 0 and plotted over time. The data show representative results for cytochalasin D and CN03 along with their vehicle controls.

