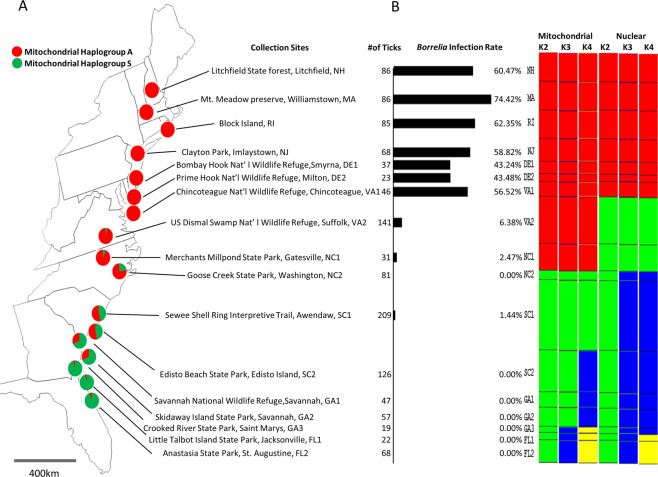
Figure 1.
Collection sites, percentage of mitochondrial Haplogroups, Borrelia infection rates and BAPS population structures. (A) Colored circles are 17 collection sites of 1232 ticks from eastern US. Red and green colors show the percentage of mitochondrial Haplogroup A and S. (B) Total tick numbers in each collection site with Borrelia infection rate. Population structure analysis is based on mitochondrial and 3 nuclear genes using BAPS. Each color represents one population.

