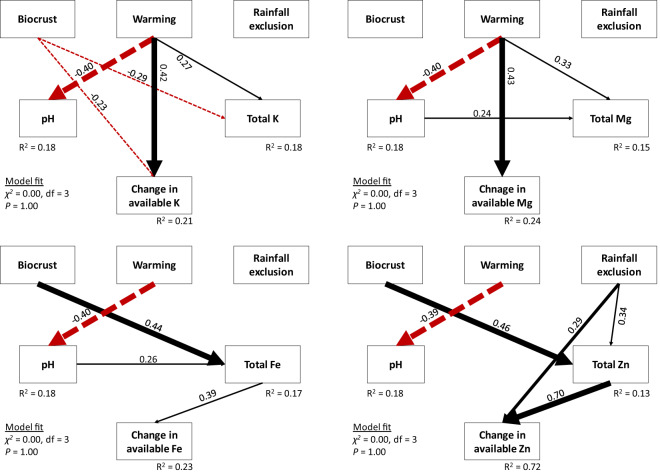
Fig. 4. Structural equation models of biotic and abiotic effects during the experiment (2010–2017).
Variables included are biocrusts, warming, rain exclusion and soil pH on the change of total and available K, Mg, Fe and Zn. Measurements were taken during the experiment (2010–2017). Numbers adjacent to arrows are standardized path coefficients (analogous to relative regression weights) and indicative of the effect of the relationship. Continuous arrows show positive and dashed arrows negative relationships, with arrow thicknesses proportional to the strength of the relationship. The proportion of variance explained (R2) is shown besides each response variable in the model. Goodness-of-fit statistics are shown in the lower left corner as the χ2. The a-priori model was refined by removing paths with coefficients close to zero (see the a-priori model in Supplementary Fig. 4).

