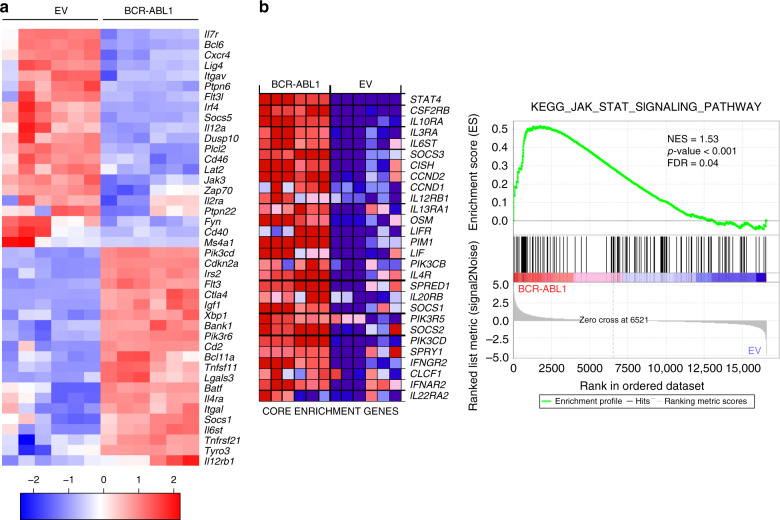
Fig. 1. Gene expression profiles of BCR-ABL1-transformed cells.
Bone marrow (BM)-derived pre-B cells isolated from two WT mice were used to generate six independent BCR-ABL1-transformed cell lines or six control cell lines expressing empty vector (EV). For expression profiling, RNA was isolated using ReliaPrep™ RNA Miniprep System (MM). All samples were subjected to RNA quality control test before the RNA-seq was applied. a Heatmap representation of selected genes related to cytokine receptor signaling from the previously specified GOs (see Supplementary Data 1) in BCR-ABL1-transformed cells compared with the EV-transduced cells. Samples are represented in columns while rows show genes. An average linking method based on Pearson correlation distance metric was applied to cluster rows and columns. b Gene Set Enrichment Analysis (GSEA) showing upregulation of gene set belonging to the JAK-STAT signaling pathway in BCR-ABL1 group. Heatmap representation (left) of the top 28 deregulated genes (core enrichment genes) in BCR-ABL1 versus EV-transduced samples (Blue: downregulated, Red: upregulated, NES normalized enrichment score, FDR false discovery rate). A two-sided signal-to-noise metric was used to rank the genes. For a calculated GSEA nominal p values of 0, we present them as p < 0.001 (otherwise, exact p values are shown). Multiple hypothesis testing correction is represented by the estimated FDR.

