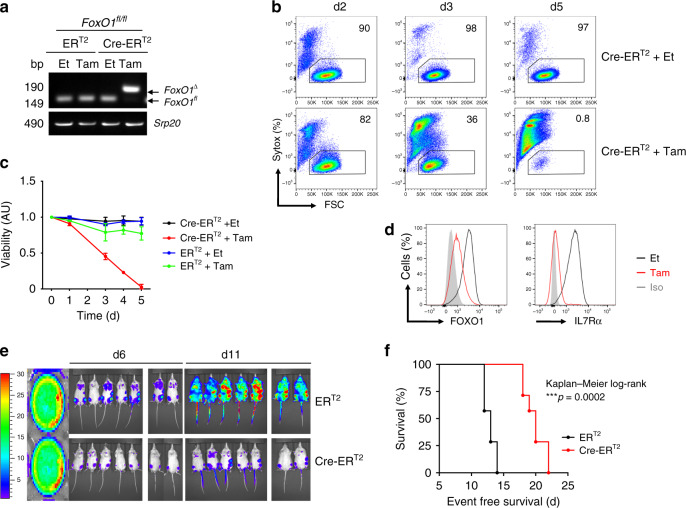
Fig. 6. FoxO1 is required for BCR-ABL1 driven leukemogenesis.
FoxO1fl/fl pre-B cells were transformed with BCR-ABL1 and were then transduced with Cre-ERT2. Cells were treated with either tamoxifen (Tam) to induce Cre expression, or with ethanol (Et). a PCR analysis for FoxO1 deletion (FoxO1∆), Srp20 was used as a loading control. Cells transduced with ERT2 were used as control. bp base pair. b The percentage of living cells were determined by flow cytometry using Syotx as excluding dead cell stain. c The fold change of living cells after treatment with either Et or Tam at different time points. N = 3 independent samples per group, and error bars represent mean ± SD. One-way ANAOVA. Dunnett’s multiple comparisons test was performed to day 5, compared with control group (ERT2 Et). Adjusted p values: ERT2 Et vs. ERT2 Tam *p = 0.0251, ERT2 Et vs. Cre-ERT2 Et n.s. p > 0.9999, ERT2 Et vs. Cre-ERT2 Tam ****p < 0.0001. AU arbitrary unit. d Intracellular staining for FOXO1 protein (left) and an extracellular staining of IL7R (right) after 72 h of Cre-induction. The results are representative of three independent experiments. e Luciferase bioimaging and f Survival curves of mice that were injected with 1 × 10⁶ FoxO1fl/fl cells that had been transformed with BCR-ABL1 and transduced with either a Cre-ERT2 construct or an empty vector control (ERT2). Cells were labeled with luciferase and injected into NOD-SCID mice. (n = 14 per group). Mantel–Cox-log-rank test, ***p = 0.0002.

