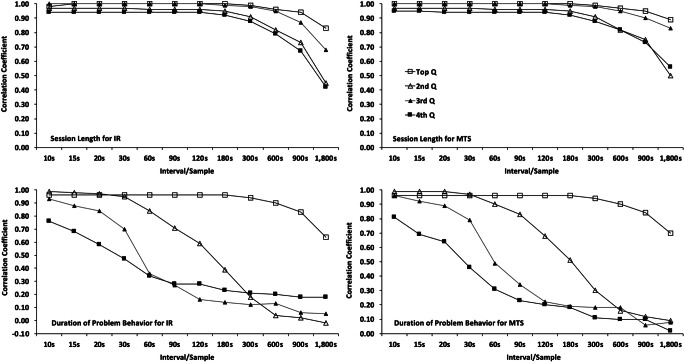
Fig. 3.
Correlation coefficients with continuous data are presented by quartile with the top quartile representing the sessions with the longest durations (top panels) and highest percentage duration of problem behavior (bottom panels). Data for PIR analysis are in the left column, and data for MTS are in the right column

