
Figure 4.
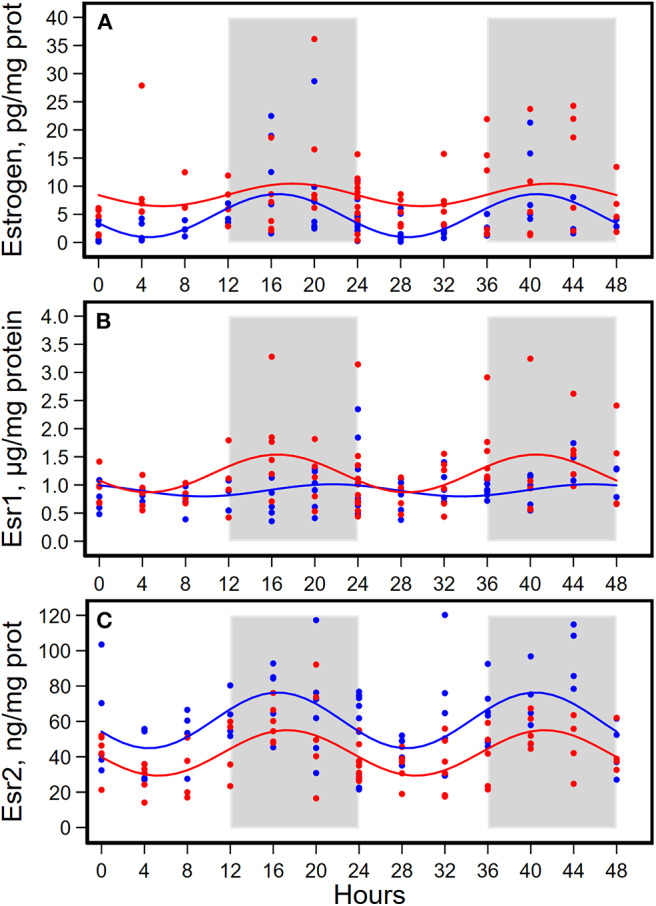
Diurnal expressions of concentrations of estrogen (A), estrogen receptor 1 (Esr1, B), and estrogen receptor 2 (Esr2, C) in mammary glands from pubertal mice fed AIN93G or high-fat diet (n = 5 per time point per group). Open background: light phase; gray background: dark phase; blue circles and line: AIN93G diet; red circles and line: high-fat diet. The rhythm curves were generated by using the Cosinor model y = mesor + amplitude x Cos [2π/24 × (t—acrophase)].