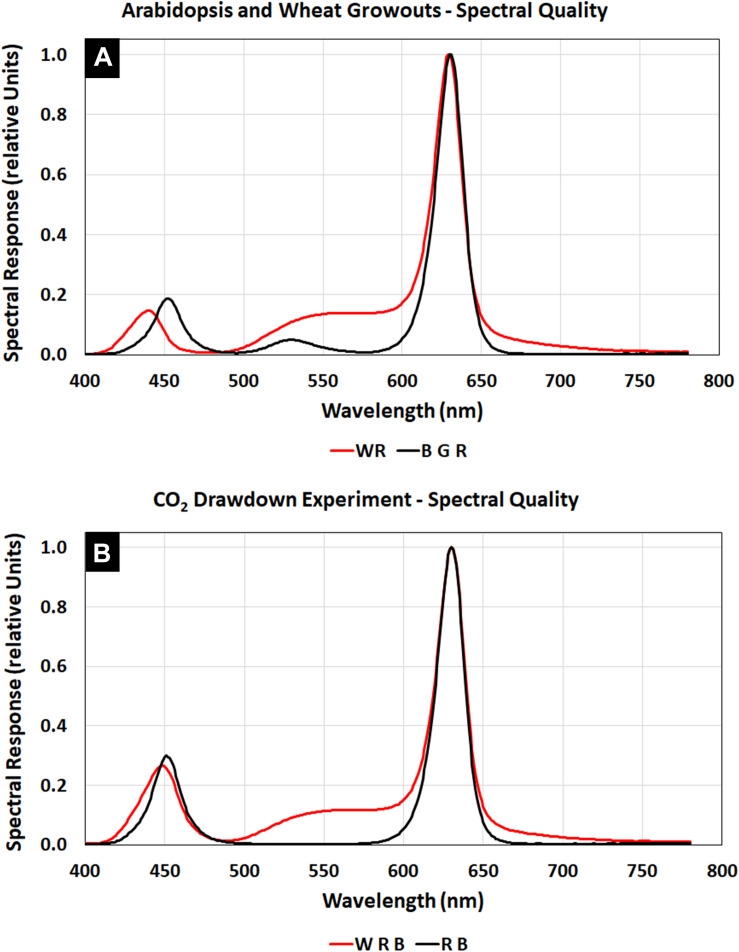
FIGURE 3.
APH GLA spectra using White, Blue, Green, and Red LEDs: (A) Spectral quality during Arabidopsis (BGR, black line) and wheat (WR, red line) plant tests. (B) Spectral quality during the CO2 drawdown experiment (WRB, red line). Comparing the WRB and RB (black line) spectra shows that white LEDs supply additional blue and red light plus substantial amounts of green light.

