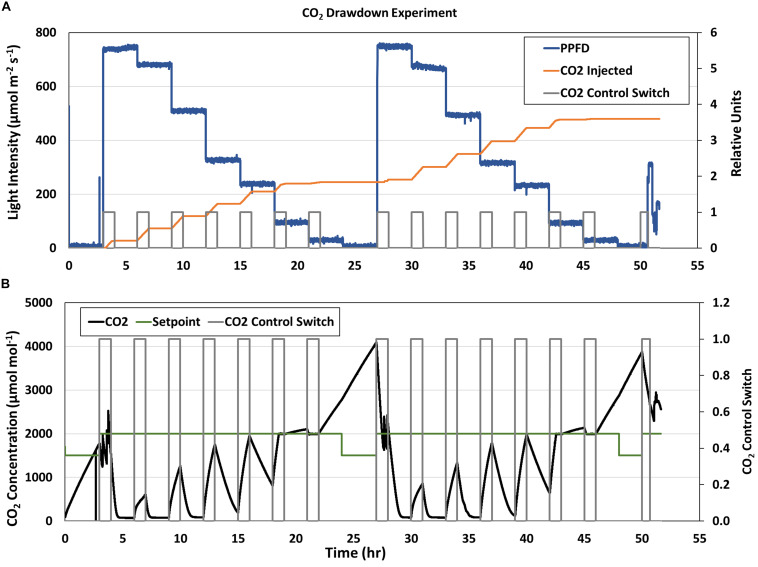
FIGURE 6.
APH CO2 Drawdown Experiment. (A) Stepwise changes in GC light intensity (blue line) and (B) CO2 concentration (black line) during the two consecutive CO2 Drawdown experiments. The CO2 control switch [(A,B), gray line] enabled CO2 injections [(A), orange line] to raise chamber CO2 to 2,000 μmol mol– 1 before each drawdown. CO2 concentration decreased when CO2 control was disabled due to photosynthetic CO2 uptake. The CO2 injection rate during the second and third drawdowns was not sufficient to overcome canopy Pnet at higher light levels and chamber CO2 concentration [(B), black line] did not reach the CO2 setpoint [(B), green line] in 1 h. As PPFD decreased, chamber CO2 reached the setpoint and even increased above it due to respiration.

