FIGURE 7.
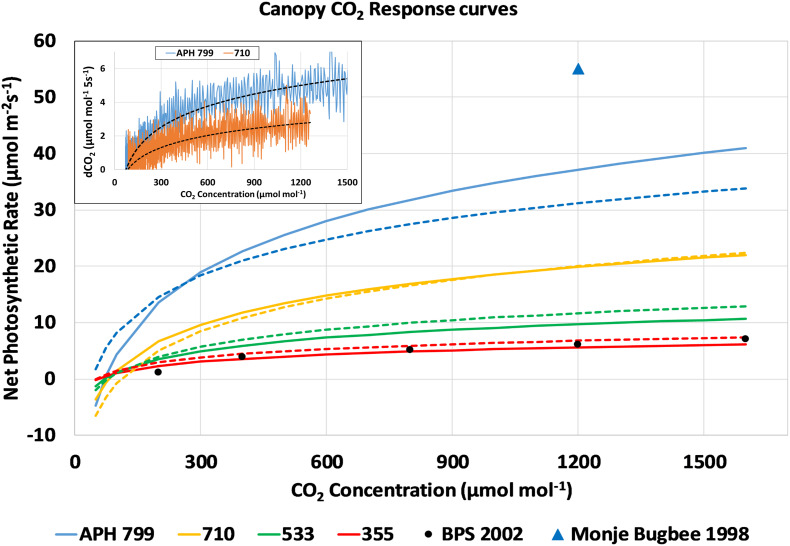
CO2 response curves of canopy photosynthesis during the CO2 drawdown experiment: Changes in chamber CO2 concentration (inset, dCO2 5s– 1) from drawdown curves measured at constant PPFD were plotted vs. CO2 concentration, fitted with a logarithmic curve, and converted into photosynthetic CO2 response curves. Response curves measured during consecutive days are shown as solid and dashed lines. For comparison, the CO2 response curve measured during PESTO is plotted (BPS 2002, black circles) and Pnet of wheat increases at higher light levels (Monje and Bugbee, 1998, blue triangle).

