Figure 2.

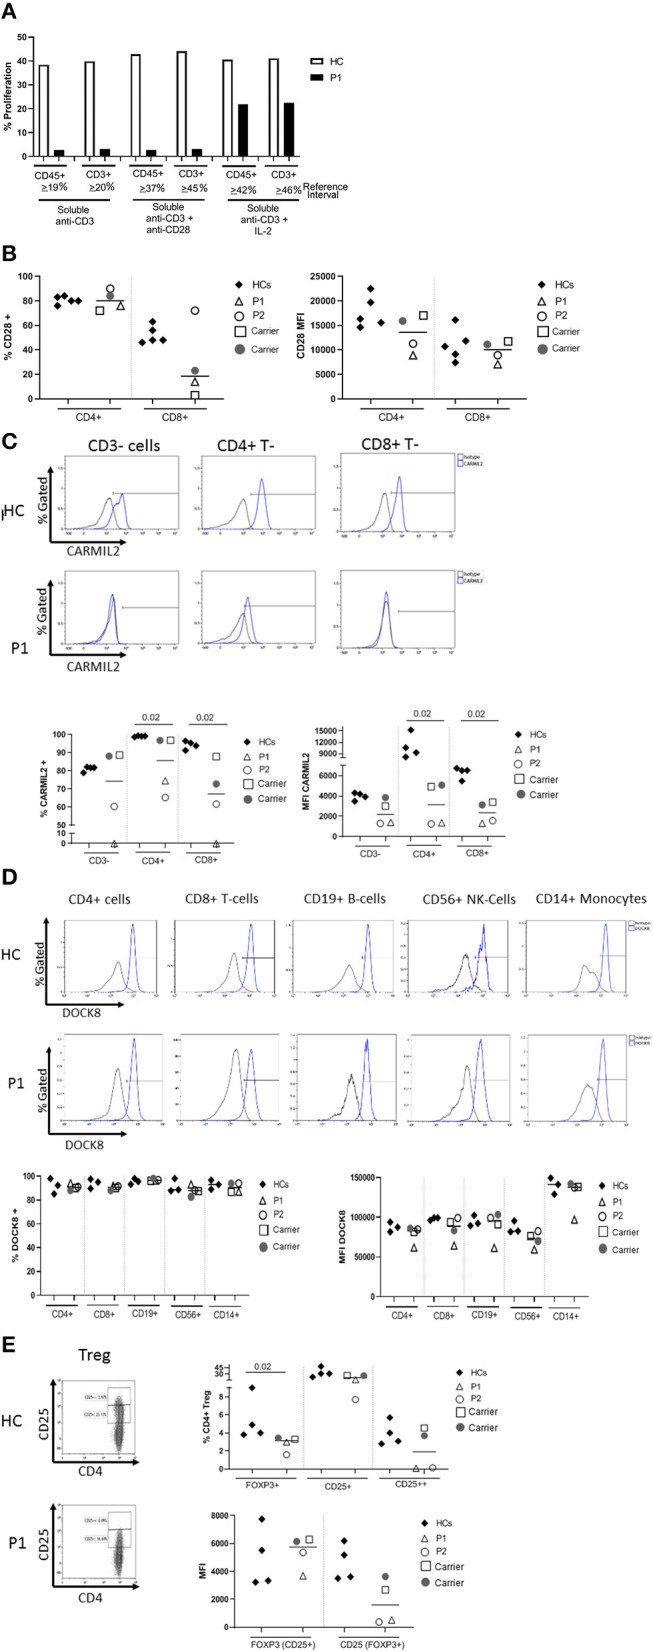
(A) Flow cytometric evaluation of T lymphocyte proliferation. T cell proliferation after stimulation with soluble anti-CD3, soluble anti-CD3 and anti-CD28, and soluble anti-CD3 with recombinant interleukin-2 (IL-2) was measured using an Edu-based® flow assay with CD45 and CD3 as markers for total lymphocytes and CD3+ T cells, respectively. Data is expressed as either % CD45+ lymphocytes relative to total CD45+ lymphocytes, and % CD3+ T cells relative to total CD3+ T cells. Data is shown with an experimental healthy control. This was performed as a clinical test validated in 101 healthy controls, and therefore multiple replicates were deemed unnecessary as clinical assays are stringently analytically validated for regulatory oversight. Further, the volume of blood required to repeat this clinical testing was contraindicated in the patient. (B) CD28 expression on CD4+ and CD8+T cells by flow cytometry. (C) CARMIL2 protein expression in CD4+ and CD8+T cells by flow cytometry. (D) DOCK8 protein expression in peripheral blood mononuclear cell subsets by flow cytometry. (E) Regulatory T-cell (Treg) phenotyping. Flow cytometric assays shown in (B–E) were performed on the proband (P1), his younger affected sibling (P2), their parents (carriers), and HCs. Assays were performed at least twice on each sample yielding consistent results. Samples from P1 and P2 were inadequate for further replicates. The frequency of CD28+ T cells is shown in the first graph, and the median fluorescence intensity (MFI) is shown in the second graph (right). The parents also show decreased frequency of CD28+ CD8+ T cells, though the MFI shows overlap between the two patients and a couple of healthy controls. CARMIL2 protein expression was assessed in both CD4+ and CD8+ T cells, as well as CD3-negative lymphocytes (B and NK cells). For DOCK8 protein expression, while the frequency of DOCK8 is comparable between P1 and P2, parents (carriers), and healthy controls, the MFI is decreased in all lymphocyte subsets and monocytes in P1. The expression (MFI) of CD25 in FOXP3+ Tregs is substantially reduced in both P1 and P2.
