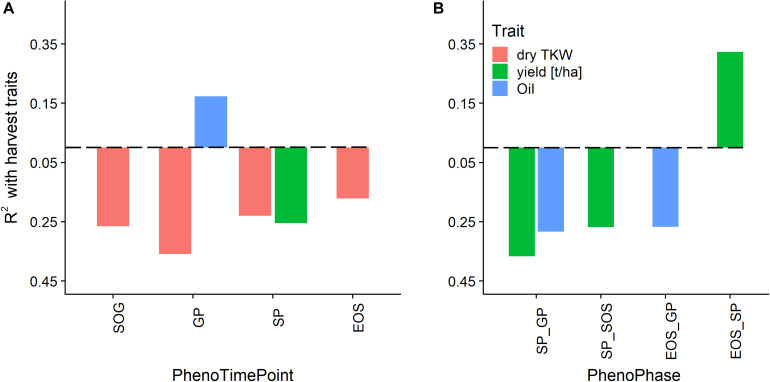
FIGURE 10.
Relationship of phenological timing of PhenoTimePoints (A) and PhenoPhases (B) with harvest traits by means of coefficient of determination (R2). Bars below the dashed line correspond to negative correlations and vice versa. For readability, only PhenoPhases with an R2 of more than 0.25 are shown (all have a p-value of <0.01).

