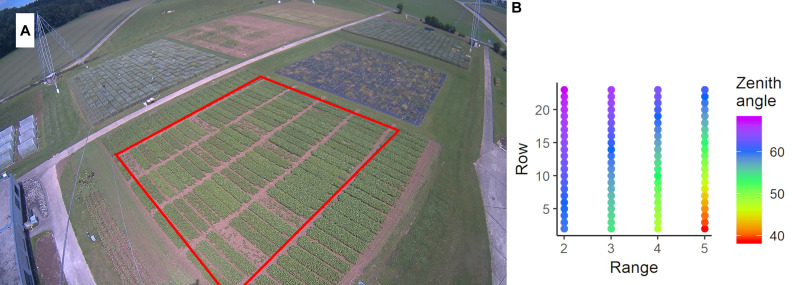
FIGURE 2.
(A) Image captured by the FIP-PhenoCam system on the June 19, 2015. The red rectangle denotes the relevant plots of the soybean experiment. The experiment is surrounded by one row of border plots. At the top-left of the image, the wheat experiment is visible. In the foreground, two cables of the field phenotyping platform are visible. (B) Average zenith viewing angle for each plot.

