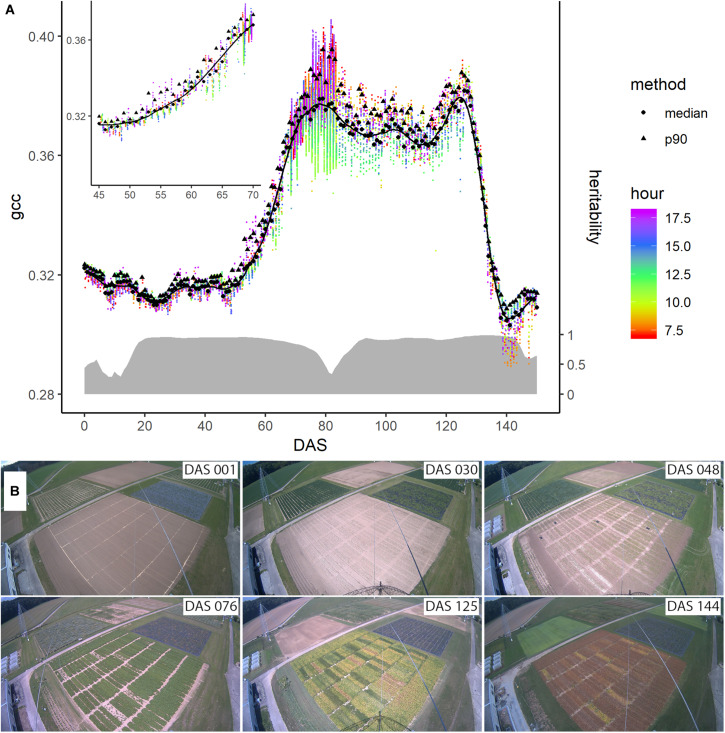
FIGURE 3.
(A) Evolution of the phenological signal of plot 4 denoted by the green chromatic coordinate (gcc) during the season. The colored dots represent the individual data points extracted from the images, while their color corresponds to the measurement time (around DAS 80 the measurement frequency of the camera was increased for a short period). The black dots and triangles are the daily averages derived from the median and the 90th percentile, respectively. The solid line represents the Savitzky-Golay smoothed median values. On the right axis and denoted with the gray ribbon is the corresponding heritability of the signal across the genotypes measured by means of heritability (H2) across the season. (B) Images taken by the digital repeat photography device at six different days, denoted in days after sowing (DAS), during the growing season of soybean.

