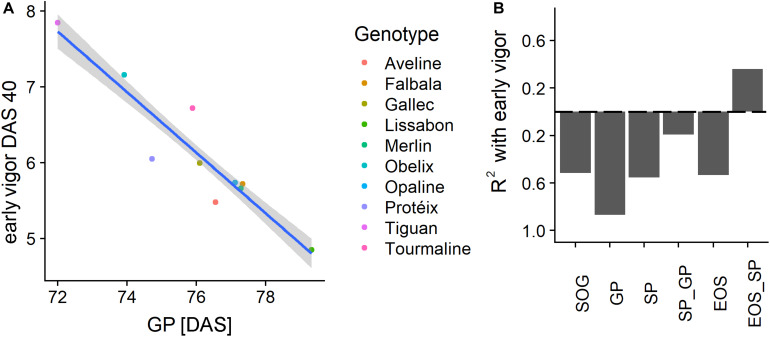
FIGURE 9.
(A) Scatterplot of the early vigor rating at days after sowing (DAS) 40 with the timing of the green peak (GP) in DAS for the different genotypes. (B) Coefficient of determination (R2) of early vigor, PhenoTimePoints, and PhenoPhases. Bars below the dashed line correspond to negative correlations and vice versa. Results for the start of season are not shown due to the low range of the values.

