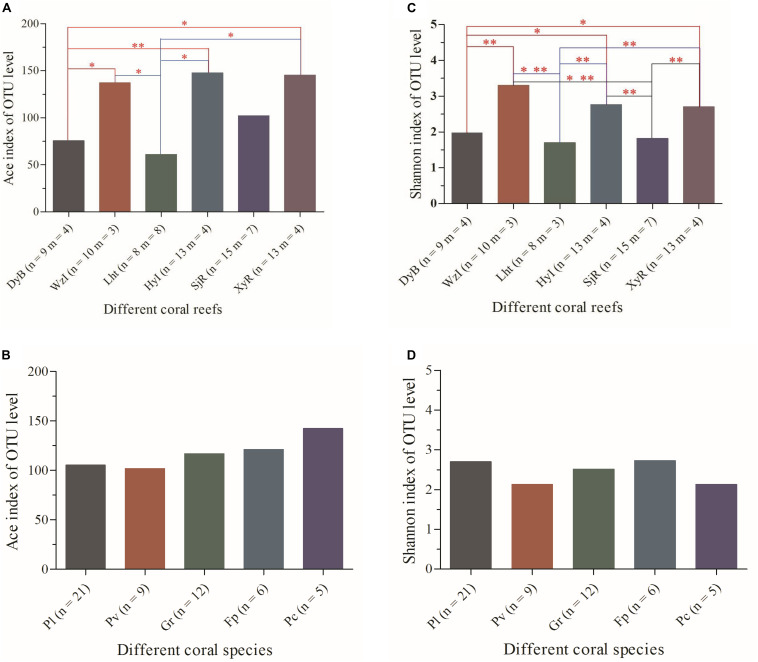
FIGURE 2.
Analysis of the differences in alpha-diversity indices of coral-associated diazotrophs between sample groups at the OTU level. (A) ACE between coral reefs, (B) ACE between coral species, (C) Shannon index between coral reefs, and (D) Shannon index between coral species. The analysis used was Student’s t-test. Significant differences are indicated by different numbers of asterisks (0.01 < p ≤ 0.05 ∗, 0.001 < p ≤ 0.01 ∗∗). Non-significant correlations do not have an asterisk. n, number of coral individuals; m, number of coral species.

