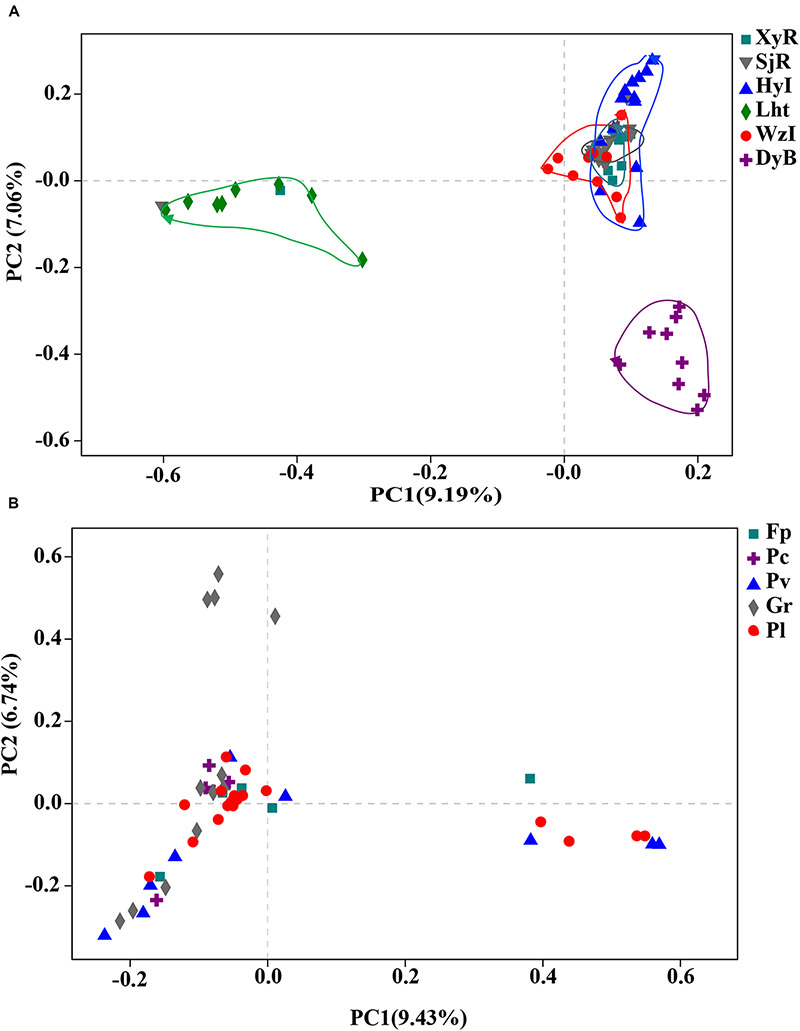
FIGURE 3.

PCoA plot at the OTU level for all coral samples collected from six different coral reefs. Coral samples were grouped according to (A) collection site and/or (B) species with ≥5 colonies from the same coral reef. Scatter plot showing principal coordinate 1 (PC1) vs. principal coordinate 2 (PC2). PC1 and PC2 represent the principal factors affecting the composition of coral-associated diazotrophs.
