
Figure 2.
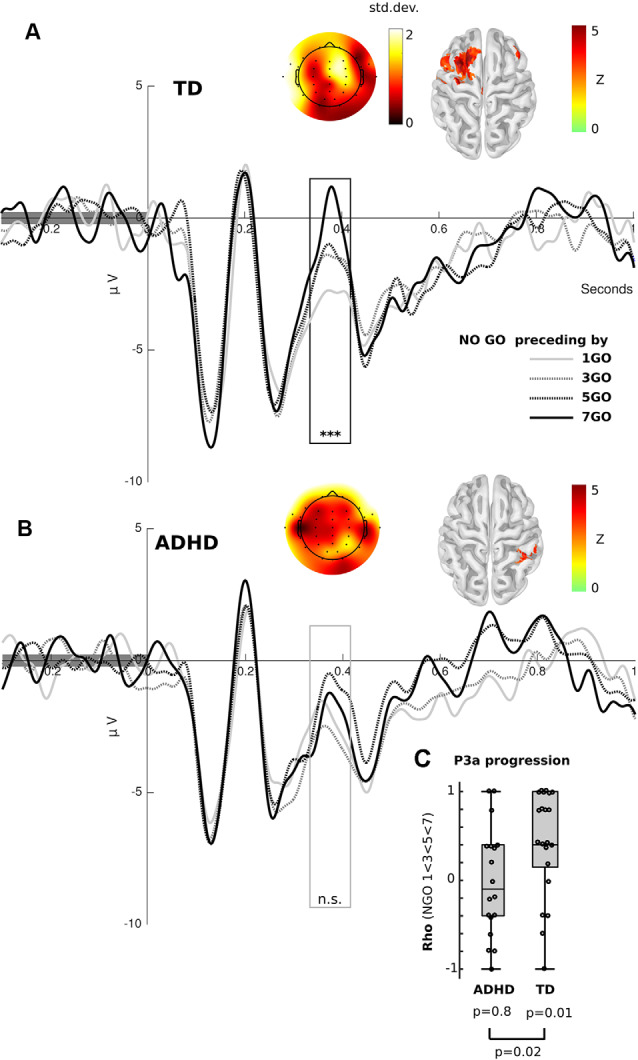
Event-related potential (ERP) results. (A) Frontal ERP elicited by Nogo stimuli separated by the number of preceding Go trials in TD children. The black box shows the significant differences between conditions [Kruskal–Wallis and Cluster-based Permutation (CBP) test, p < 0.01]. (B) Frontal ERP elicited by Nogo stimuli separated by the number of preceding Go trials in ADHD children. The gray box represents the P3a, where significant differences were found for the TD group, but not for the ADHD children (Kruskal–Wallis, p > 0.05, uncorrected). (A,B) Color in the scalp plot represents the standard deviation between conditions. In the cortex surface (source space), the Z-value of the difference among conditions is plotted. (C) Box plot of the spearman rho value of the correlation between P3a peak (FCz electrode) and the number of preceding Go stimuli per subject, separated by group. ***p < 0.001, n.s. = p > 0.05.