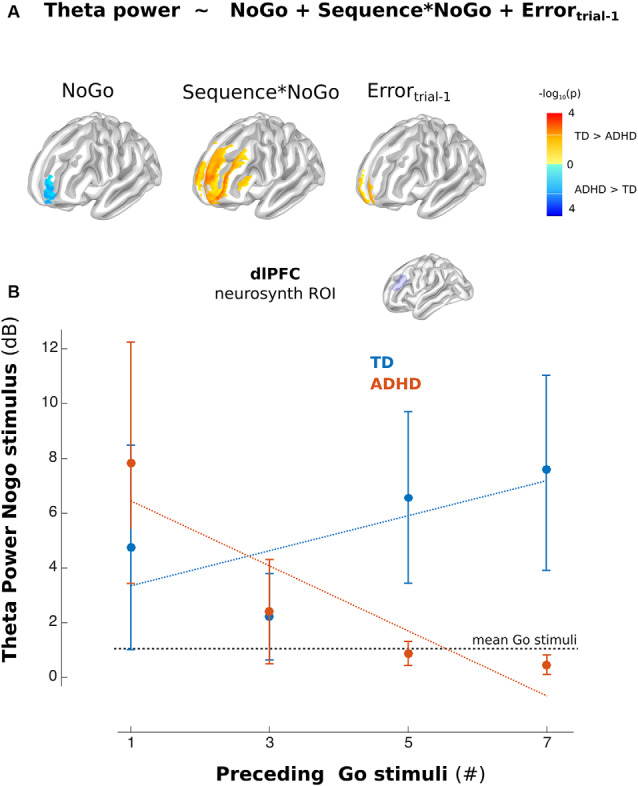
Figure 4.

Theta activity in the left Lateral PFC (lPFC). (A) Model used in Time-frequency analysis. The color indicates the differences between the corresponding regressors between groups (Blue ADHD>TD and Red TD>ADHD, p < 0.01 uncorrected). (B) Mean of the power of the lPFC (dorsolateral PFC from Neurosynth) ROI for Nogo stimuli related to Go stimuli separated per sequence (illustrative propose). Error bars represent standard error of the mean.
