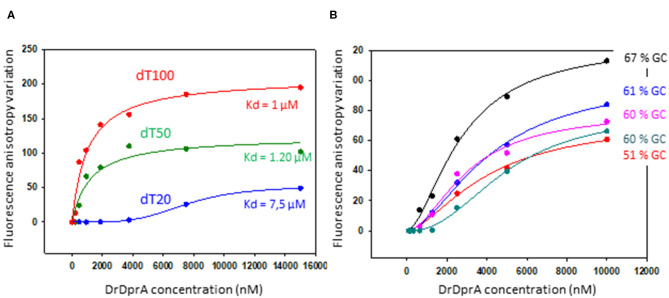
Figure 5.
DNA binding analysis of DprA. Equilibrium binding of DprA to fluorescein-labeled dT20, dT50, or dT100 ssDNA (A) or 35-mer oligonucleotides of various GC content percentage (B). Fluorescence anisotropy variation with increasing concentrations of DprA fit to a single-ligand–binding model with SigmaPlot-calculated (apparent) Kd of 7.5, 1.2, and 1 μM for the three poly-dT, respectively.

