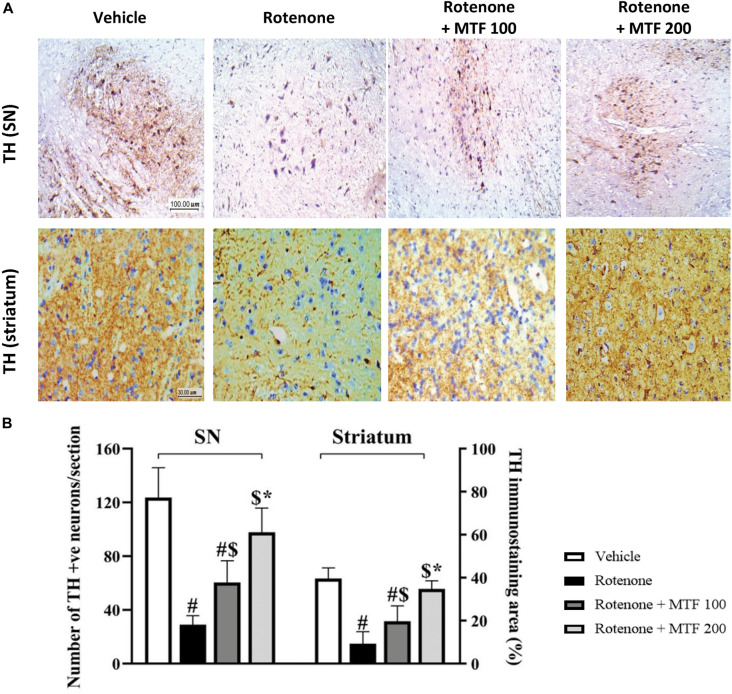
FIGURE 7.
Immunohistochemistry staining for tyrosine hydroxylase in rotenone-parkinsonian mice. (A) The above panel shows images from the substantia nigra of the vehicle control group with multiple healthy TH-positive somas with regular shape and rounded large nuclei, and the striatum shows widespread positive regular staining. The image from the rotenone group shows a low number of healthy TH-positive cell somas and low scattered TH staining in the striatal nerve terminals. The rotenone + MTF 100 mg/kg group shows a higher number of TH-positive somas in the substantia nigra and higher striatal TH staining. The rotenone + MTF 200 mg/kg group shows improved TH staining in the cell somas and the striatal nerve terminals. (B) A column chart illustrating the number of TH-positive neurons per section in the substantia nigra pars compacta (left panel) and the striatal percent of TH-positive neurons (right panel). Results are expressed as mean ± SD and analyzed by applying one-way ANOVA followed by Bonferroni’s test. #: Different from vehicle group. $: Different from rotenone group. *: Different from rotenone + MTF 100 mg/kg group at p < 0.05 (n = 6).

