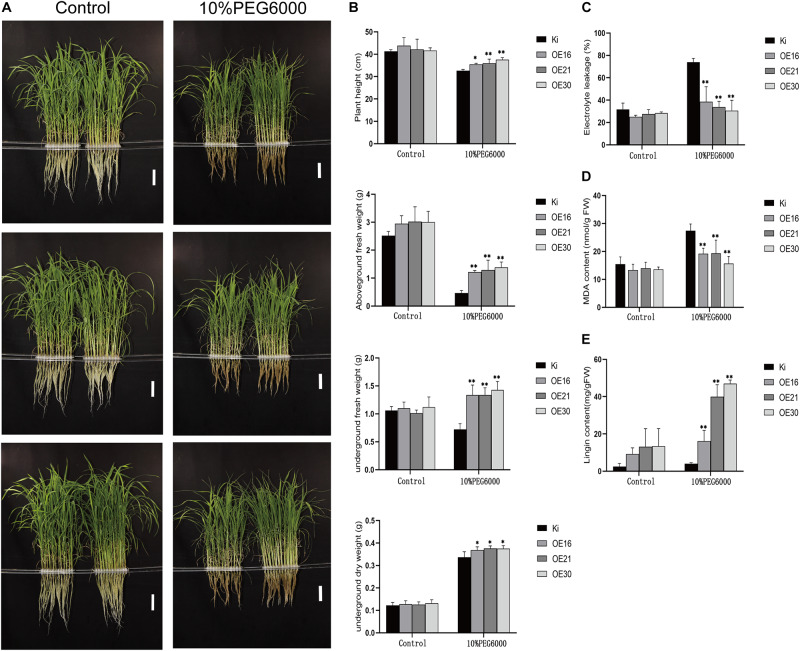
FIGURE 5.
Phenotypic analysis of transgenic rice plants and wild-type controls in response to 10% PEG6000 treatments. (A) Phenotype of wild-type controls and transgenic rice plants under normal and 10% PEG6000 conditions in a hydroponic drought experiment. Bar = 7 cm. (B) Root length, plant height, aboveground fresh weight, underground fresh weight, aboveground dry weight, and underground dry weight under normal growth conditions and after 10% PEG6000 treatment. Relative electrolyte leakage (C), MDA content (D), and lignin content (E) under normal growth conditions and after 10% PEG6000 treatment. Data represent the mean ± SD (n = 4), *P ≤ 0.05, **P ≤ 0.01, t-test.

