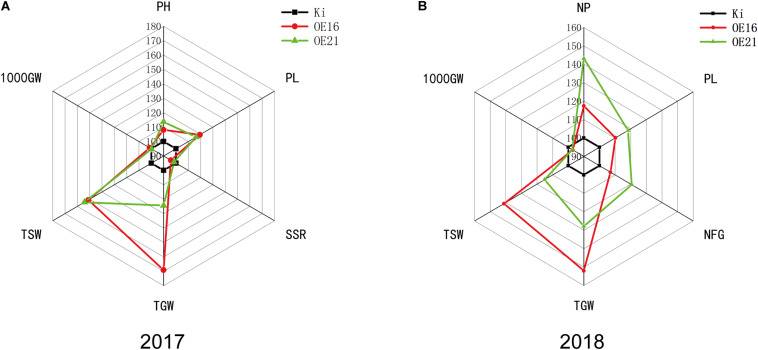
FIGURE 6.
Phenotypic analysis of transgenic rice plants and wild-type controls grown under field-drought conditions. Spider plots of the agronomic traits of two independent homozygous T3 lines of transgenic rice plants and corresponding wild-type controls under field-drought conditions in year 2017 (A) and 2018 (B). Each data point represents the percentage of the mean values (2017, n = 2; 2018, n = 3). The mean measurements from the wild-type controls were assigned a 100% reference value. PH, plant height; SSR, seed setting rate; NP, number of panicles per hill; PL, panicle length; NFG, number of filled grains; TGW, total grain weight; TSW, total straw weight; 1000GW, 1,000 grain weight.

