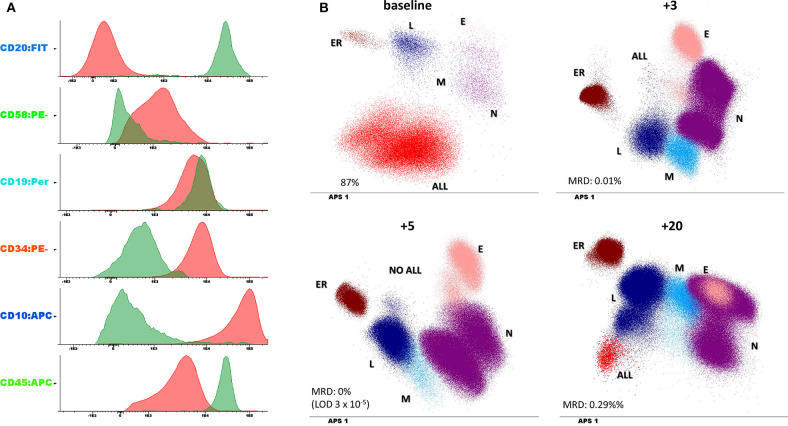
Figure 1.
(A) Leukemic phenotype at baseline. The histograms report both the leukemic clone (in red) and the normal B cell compartment (in green) to underscore the expression of aberrant markers. (B) minimal residual disease (MRD) evaluation performed at 4 different timepoints (the number on the top of each panel represents the number of months from diagnosis) and compared with baseline phenotype. Dotplots are represented with a dimensionality reduction approach (principal component analysis or automatic population separator (APS) in infinicyt software, Cytognos) which allow the identification of the different immune population within the bone marrow (L, lymphocytes; ER, erythroblasts; N, granulocytes; M, monocytes; E, eosinophils; ALL, leukemic clone).

