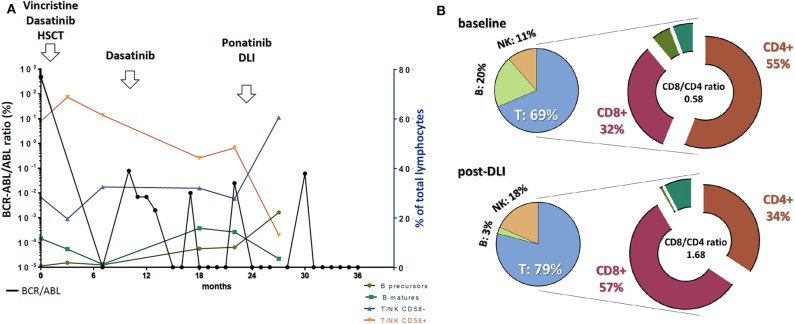
Figure 2.
(A) Trends in BCR-ABL transcript levels in peripheral blood coupled with different normal immune populations distribution within the bone marrow along disease evolution and in response to different treatments. BCR-ABL/ABL ratio values are reported on the left vertical axis while cell population abundance refers to the right axis. (B) T, NK, and B cell representation within the whole lymphocyte group at baseline and after ponatinib + donor lymphocytes infusion (DLI). Notably, within the T cell compartment we observed an inversion in the CD8/CD4 ratio, favoring the CD8 compartment after DLI treatment.

