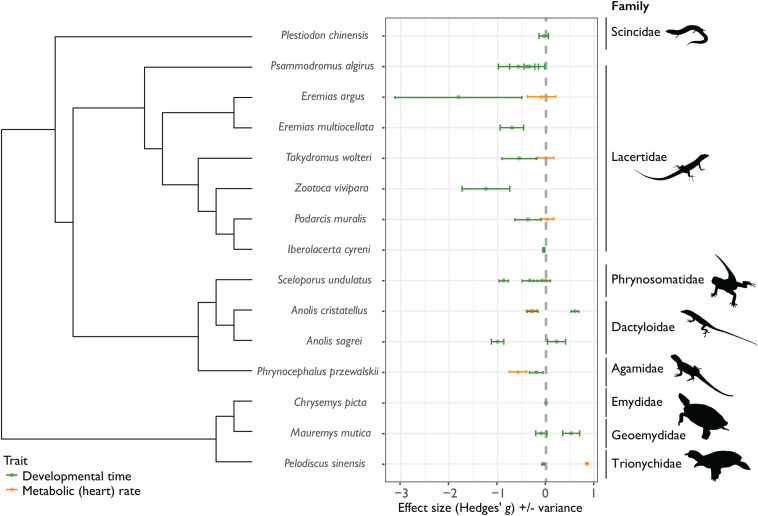
FIGURE 2.
Effect sizes (Hedges’ g) for differences in the thermal sensitivity of development time (time from oviposition until hatching) and metabolic (heart) rate across cold and warm-adapted populations for 15 species of reptiles across 8 families (± variance). For development time (D; green data points and variance bars), positive Hedges’ g values indicate positive Cov(G,E), or cogradient variation, where cold-adapted populations have longer D, relative to warm-adapted populations. Negative values of D indicate negative Cov(G,E), or countergradient variation, where genotypic differences oppose environmental temperature effects – in these instances, cold-adapted populations develop faster than warm-adapted populations. For metabolic rates (MR; orange data points and variance bars), negative Hedges’ g values indicate positive Cov(G,E), or cogradient variation, where cold-adapted populations have lower MR, relative to warm-adapted populations, while positive values of MR indicate negative Cov(G,E), or countergradient variation – here cold-adapted populations maintain higher MR, relative to warm-adapted populations.

