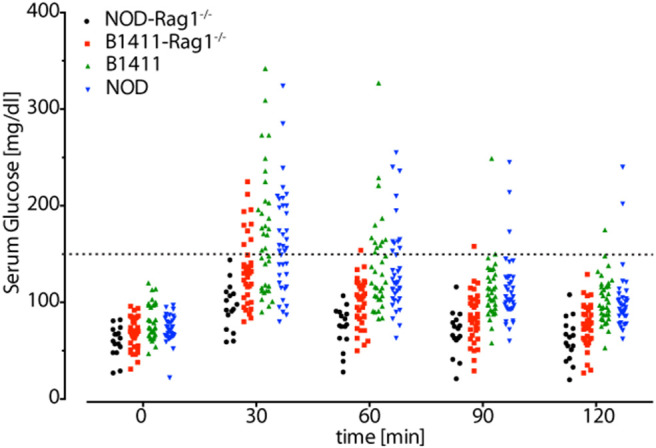
Figure 8.

Glucose tolerance test. Fasting serum glucose levels (time = 0 min) were determined for NOD-Rag1−/− (black circles), B1411-Rag1−/− (red squares), B1411 (green triangles), and NOD (blue triangles) mice. Mice were injected with 2 g glucose per kg body weight and serum glucose levels were determined in 30 min intervals. Mice with serum glucose levels above 150 mg/dl (dotted line) possess impaired glucose tolerance. Each symbol represents one mouse.
