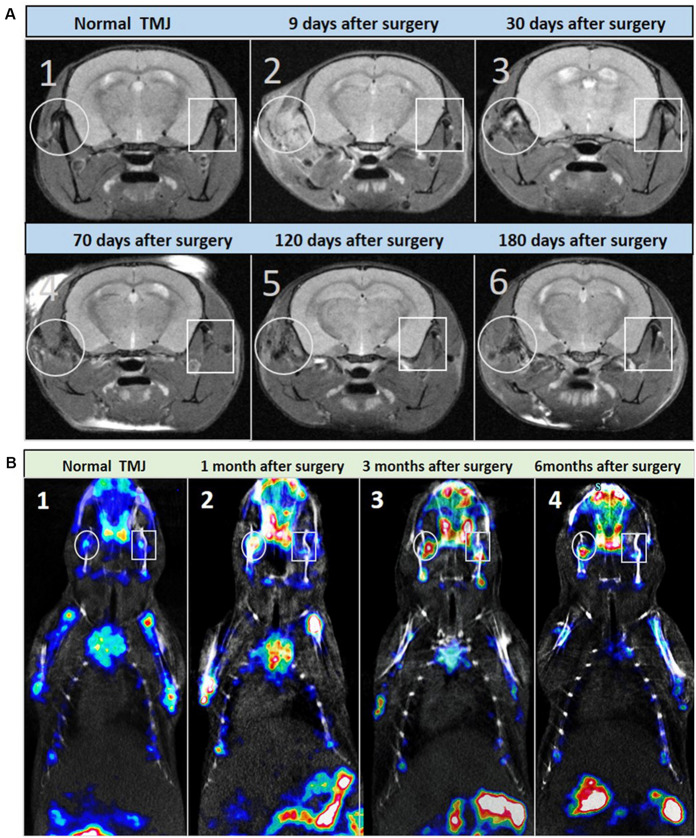
FIGURE 3.
Micro-MRI and micro-SPECT examination of the first animal model (the articular disc and half condylar cartilage were removed) during the development of THO-TMJ. (A) Micro-MRI examination results showed a strong T2 signal around the TMJ on the injured side, which was gradually reduced and replaced by a weak signal of heterotopic ossification compared with the normal side of the TMJ in the animal model (A2–A6) and the TMJ in the normal control mice (A1) over time. (B) Micro-SPECT examination results showed no obvious difference in bone metabolism between the two sides of the TMJ in normal control mice (B1), but it showed strong bone metabolism (red color) in the injured TMJ region compared with that in the normal side at different time points after surgery (B2–B4); white circle: left, injured TMJ; white rectangle: right, normal TMJ.

