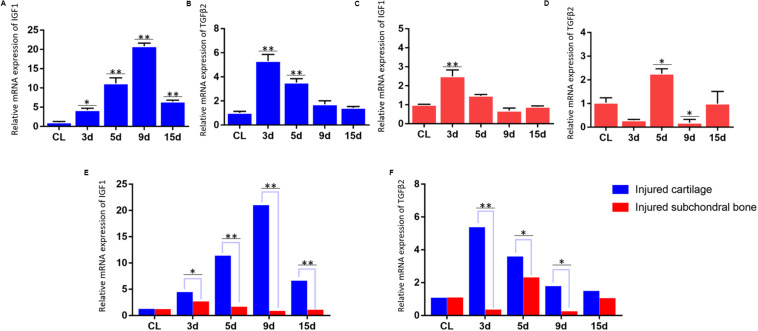
FIGURE 4.
qPCR results for the mRNA expression of IGF1 and TGFβ2. (A,B) Dynamic changes in IGF1 and TGFβ2 mRNA expression in the injured TMJ region at different time points in the first animal model (the articular disc and half condylar cartilage were removed) compared with the control groups (normal cartilage). (C,D) Dynamic changes in IGF1 and TGFβ2 mRNA expression in the injured TMJ region at different time points in the second animal model (the articular disc and total condylar cartilage were removed) compared with the control groups (normal subchondral bone). (E) Comparison of the relative change of IGF1 mRNA in the injured TMJ region between the first animal model and the second animal model at different time points. (F) Comparison of the relative change of TGFβ2 mRNA in the injured TMJ region between the first animal model and the second animal model at different time points. Abbreviation: CL, control; 3 d, 5 d, 9 d, and 15 d indicate 3 days, 5 days, 9 days, and 15 days, respectively; ∗p < 0.05, ∗∗p < 0.01.

