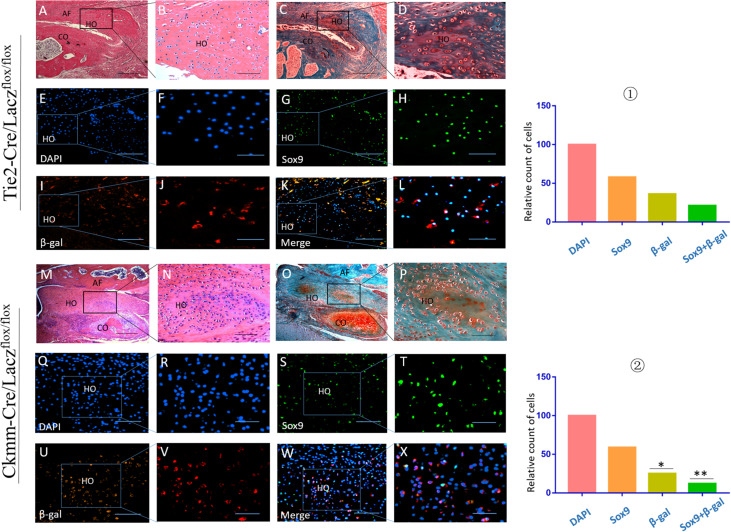
FIGURE 9.
Precursor cell lineage tracing in THO-TMJ. H&E examination (A,B,M,N) and safranin O and fast green examination (C,D,O,P) revealed the structure of the TMJ, which suffered from obvious HO. (E–L) Precursor cell lineage tracing in heterotopic ossification tissues in the Tie2-Cre/Laczflox/flox THO-TMJ mouse model. (Q–X) Precursor cell lineage tracing in heterotopic ossification tissues in the Ckmm-Cre/Laczflox/flox THO-TMJ mouse model. (E,F,Q,R) DAPI staining. (G,H,S,T) Sox9 staining. (I,J,U,V) Immunofluorescence staining of β-gal. (K,L,W,X) Merged images of DAPI, Sox9, and β-gal. ① The relative cell counts of different markers in Tie2-Cre/Laczflox/flox THO-TMJ mice, with the count of DAPI regarded as 100 and the counts of other markers calculated and compared with the count of DAPI. ② The relative cell counts of different markers in Ckmm-Cre/Laczflox/flox THO-TMJ mice showed fewer β-gal-positive cells and β-gal/Sox9 costained cells than observed in Tie2-Cre/Laczflox/flox THO-TMJ mice (*p < 0.05, **p < 0.01). Panels (B,D,F,H,J,L,N,P,R,T,V,X) are local magnifications of the boxed areas in panels (A,C,E,G,I,K,M,O,Q,S,U,W). AF, articular fossa; CO, condyle; HO, heterotopic ossification. Scale bar: (A,C,M,O), 200 μm; (B,D,E,G,I,K,N,P,Q,S,U,W), 50 μm; (F,H,J,L), 25 μm; (R,T,V,X), 20 μm.

