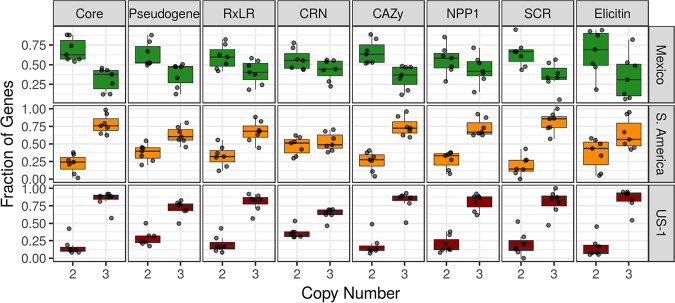
FIG 4.
Gene copy number variation is not restricted to a particular class of gene. The x axis shows the proportion of genes within each gene class (columns labeled at top) classified as being 2× or 3× copy number. The y axis shows the fraction of genes classified into 2× or 3× within a gene class. Columns show gene families, and rows show results by population. Isolates from Mexico (green), where P. infestans is sexually reproducing, had a gene copy number predominantly of two for all classes of genes. Isolates from South America and US-1, both considered clonally reproducing, had a gene copy number predominantly of three for all gene classes. Gene copy number varies throughout gene space and is not associated with function. Box and whisker plots summarize points that represent samples (n = 6) and the proportion of genes that were either 2× or 3× (based on the total number of 2× and 3× genes). A sample size of six was used (as in Fig. 3) to have equal samples sizes. Core, core orthologous genes; other gene families are defined as in Haas et al. (23).

