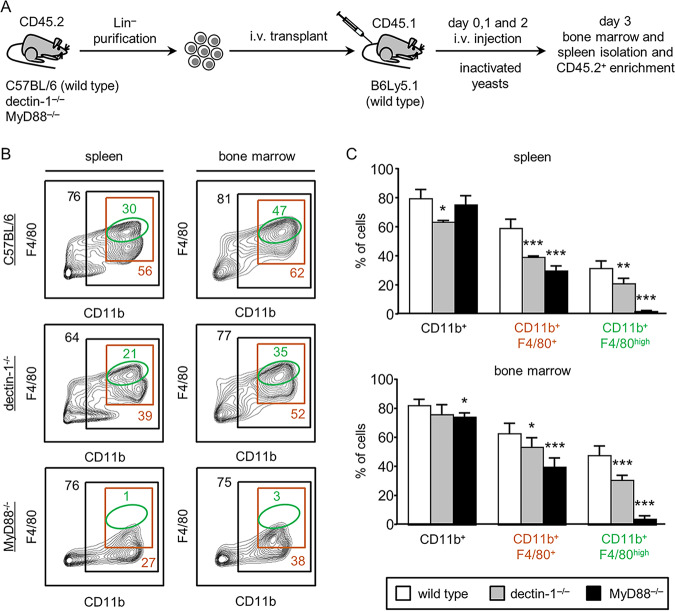
FIG 2.
In vivo differentiation of dectin-1−/− or MyD88−/− CD45.2 Lin− progenitor cells in response to stimulation with C. albicans inactivated yeasts. (A) Schematic protocol of cell transplantation and stimulation (see Materials and Methods). (B and C) The CD45.2 population was gated, shown in CD11b versus F4/80 contour plots, and subgated as CD11b+, double-positive CD11b+ F4/80+ cells, and CD11b+ F4/80high cells. The indicated percentages refer to total CD45.2 cells analyzed. Representative plots (B) and bar graphs (C) of data expressed as means ± SD from two independent experiments (three mice per condition and experiment). *, P < 0.05; **, P < 0.01; ***, P < 0.001 with respect to CD45.2 cells recovered from WT C57BL/6 transplanted progenitor cells.

