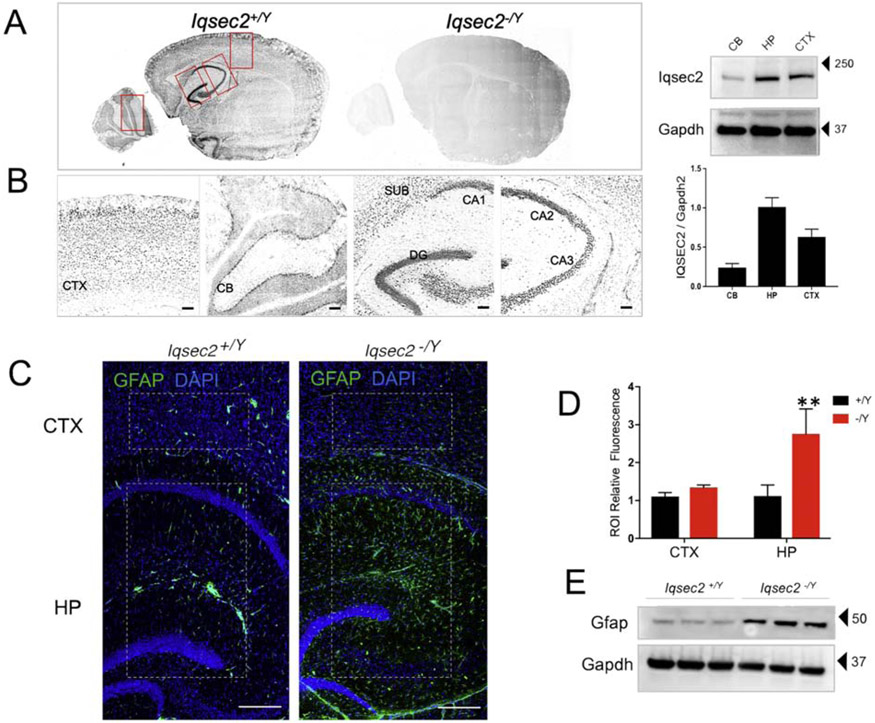
Figure 3: IQSEC2 expression and reactive gliosis in the hippocampus.
A. Sagittal sections of PND21 mice stained with antibody against IQSEC2 (antiserum UCT88). Staining is present in Iqsec2+/Y (n=5 animals) sections and absent from Iqsec2−/Y (n=4 animals) sections confirming lack of protein expression. B. The boxed regions in panel A were zoomed in to show staining in the cortex, cerebellum and hippocampus. Expression pattern revealed increased staining in the hippocampus including CA1, CA2, CA3, dentate gyrus and subiculum Scale bar is 20 μm. Western blot run with 50 micrograms of protein loaded from cerebellar, hippocampal and cortical lysates from a PND28 Iqsec2+/Y brain and stained against IQSEC2 and loading control GAPDH. Graph shows IQSEC2 expression normalized to input, n=3; Error bars represent standard deviation of the mean value. C. Representative sections show that astrogliosis is absent in adult Iqsec2+/Y sections (n=5 mice) but present and confined to the hippocampus in Iqsec2−/Y sections (n=7 mice). Scale bars: 200 μm Boxed regions in Panel A indicate region of interest (ROI) used for immunofluorescence quantification. D. Graph shows quantification of ROI-specific GFAP fluorescence for cortex and hippocampus compared between the genotypes. Mann Whitney U test, **p< 0.01; error bars indicate ± SEM E. Western blot shows 50 ug of hippocampal lysate from 3 individual animals from each genotype (PND45–60) probed against GFAP and loading control GAPDH.

