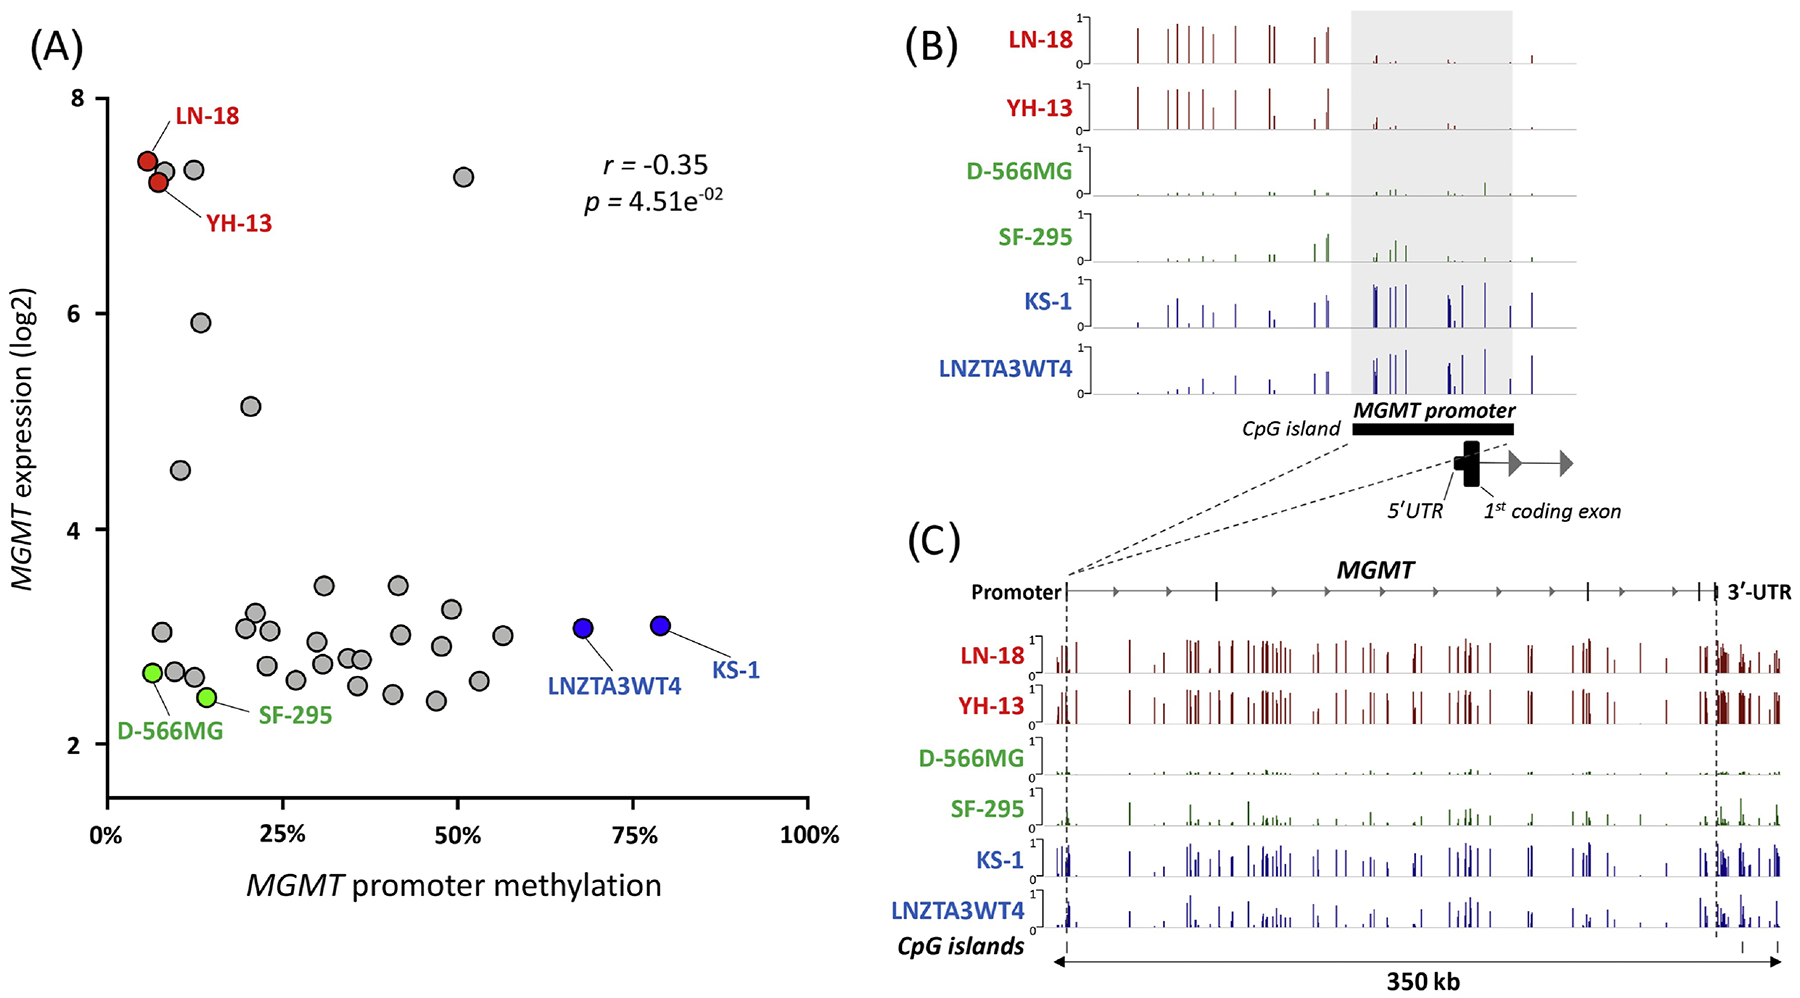
Figure 1.

Association of MGMT mRNA expression with DNA methylation. A) Plot of MGMT gene expression levels and promoter methylation levels in glioblastoma cell lines using Genomics of Drug Sensitivity in Cancer Project (GDSC) data from CellMinerCDB (http://discover.nci.nih.gov/cellminercdb) [52]. Six cell lines were selected based on expression and promoter methylation for further visualization: 1) high expression and low promoter methylation (red), 2) low expression and low promoter methylation (green) and 3) low expression and high promoter methylation (blue). B) Promoter and C) gene body probe level methylation (beta values) of MGMT gene for the six selected cell lines.
