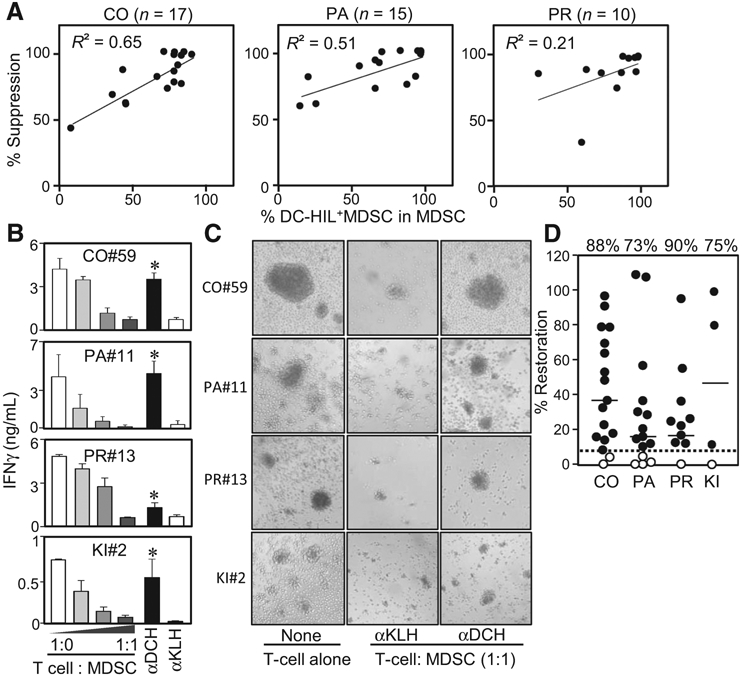
Figure 2.

Anti-DC-HIL mAb restored the suppressed T-cell IFNγ response caused by MDSCs. A, Individual patients with colorectal (CO), pancreatic (PA), or prostate (PR) cancer was determined for percentage of DC-HIL+ cells among MDSCs and their ability to suppress T-cell IFNγ response, expressed as percentage of T-cell suppression at cocultures of a 1:1 cell ratio. Values (percentages) were plotted and analyzed for correlation coefficient R2. B, Representative data of T-cell restoration assays by 3D5 anti-DC-HIL mAb: MDSCs were isolated from the blood of indicated patients and cocultured with autologous T cells at different cell ratios with costimulations. 3D5 (αDCH) or control anti-KLH mAb (αKLH) was added to 1:1 cocultures. Five days after culturing, IFNγ amounts were determined and shown in median ± SD, n = 3. *, P < 0.05 compared with cocultures treated with anti-KLH mAb. αDCH, anti-DC-HIL mAb; αKLH, anti-KLH mAb; CO, colorectal, KI, kidney; PA, pancreatic; PR, prostate. C, Photos of day 3 cocultures are shown, with aggregates representing T-cell activation. αDCH, anti-DC-HIL mAb; αKLH, anti-KLH mAb; CO, colorectal, KI, kidney; PA, pancreatic; PR, prostate. D, Assays examining effects of 3D5 mAb on the T-cell suppressor function of MDSCs were performed with samples from patients with colorectal (CO; n = 17), pancreatic (PA; n = 15), prostate (PR; n = 10), and kidney (KI; n = 4) cancer. The ability to reverse the suppressor activity is expressed by percentage of restoration in IFNγ response; set IFNγ amounts in culture of T cells alone as 100%. Solid and dashed lines show median of percentage of restoration (shown on the top) in each cancer type and the cutoff value, respectively. Closed and open circles represent patients who showed higher and lower, respectively, than the cutoff value.
