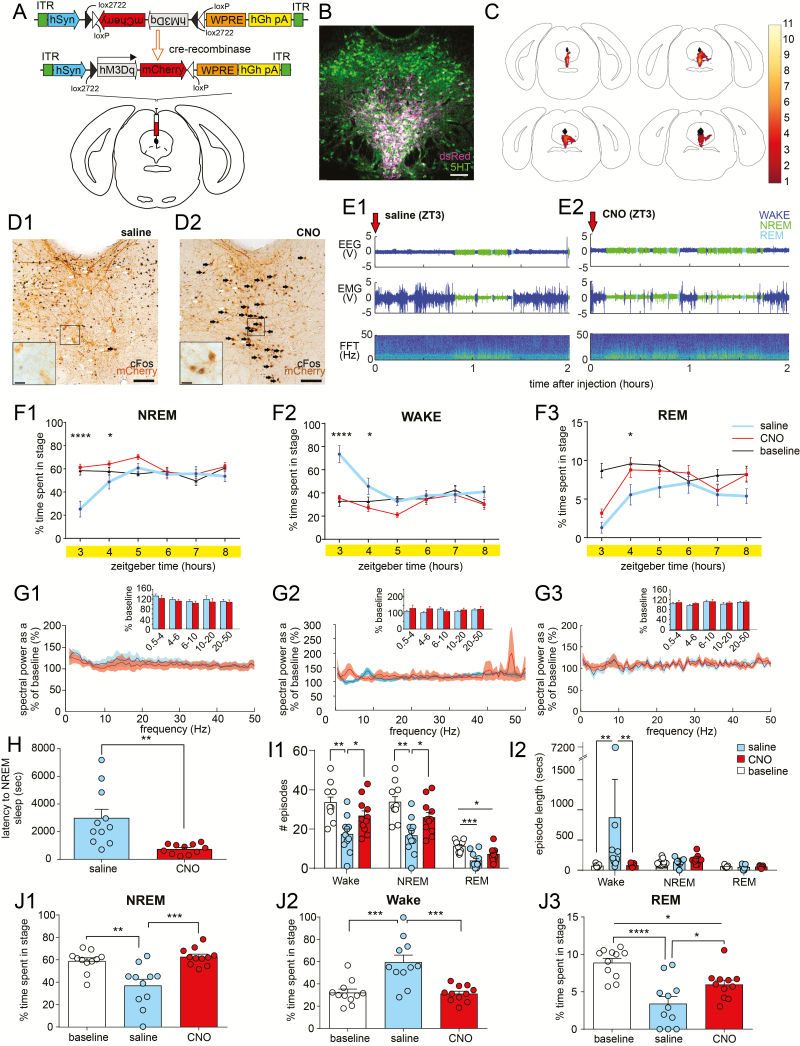
Figure 2.
Conditional activation of DRN5HT neurons reduces the latency to NREM sleep. (A) Schema of hSyn-FLEX-hM3Dq-mCherry-AAV10 construct and viral targeting to the DRN of SERT-cre mice. (B) Dual immunolabeling (white) against hM3Dq-mCherry (magenta) and 5HT (green) in DRN SERT+ cell bodies. Scale bar: 100 μm. (C) Heatmap illustrating overlapping regions of hM3Dq-Cherry-transduced neurons in SERT-Cre mice (n = 11). (D) Dual immunolabeling against hM3Dq-mCherry (brown) and c-Fos (black) in SERT-cre cell bodies after injection of saline (D1) or clozapine-N-oxide (CNO; D2) at ZT3, 90 minutes prior to sacrifice. Colocalization of mCherry and c-Fos (black filled arrows) was present in CNO injected mice, whereas c-Fos was not observed in hM3Dq-mCherry+ cells in saline-injected mice (black outlined arrows). Scale bars, 100 μm. Insets shows a higher magnification of the boxed area, scale bar: 20 μm. (E) Raw data examples showing EEG/EMG and spectrogram for 2 hours following the saline (E1) or CNO injection (E2). (F) Percentage of NREM sleep (F1), wake (F2), and REM sleep (F3) after ZT3 saline and CNO injection, and in the baseline condition (n = 11). Mean ± SEM, *p < 0.05, **p < 0.01, ****p < 0.0001, repeated-measures two-way ANOVA followed by Tukey’s post hoc test. (G) Fast Fourier transform (FFT) analysis of NREM sleep (G1), wake (G2) and REM sleep (G3) following ZT3 saline and CNO injection (n = 7). Data is expressed as mean ratio of power at each frequency after injection compared with the baseline, shaded areas indicate SEM. Inserts show averaged frequency bands + SEM. Repeated-measures two-way ANOVA. (H) Latency to first episode of NREM sleep following injection of saline or CNO (n = 11). Mean + SEM, **p < 0.01, paired t-test. (I1) Number of wake, NREM sleep, and REM sleep episodes during the first 2 hours following ZT3 injection of saline or CNO and in the baseline condition (n = 11). Mean + SEM, *p < 0.05, **p < 0.01, repeated-measures one-way ANOVA followed by Tukey’s post hoc test. (I2) Length of wake, NREM sleep, and REM sleep episodes during the first 2 hours following ZT3 injection of saline or CNO and in the baseline condition (n = 11). Mean + SEM, **p < 0.01, Friedman test followed by Dunn’s multiple comparison tests. (J) Percentage of NREM sleep (J1), wake (J2), and REM sleep (J3) between ZT3 and ZT5 at baseline and following ZT3 injection of saline or CNO (n = 11). Mean + SEM, *p < 0.05, **p < 0.01, ***p < 0.001, ****p < 0.0001, one-way ANOVA.

