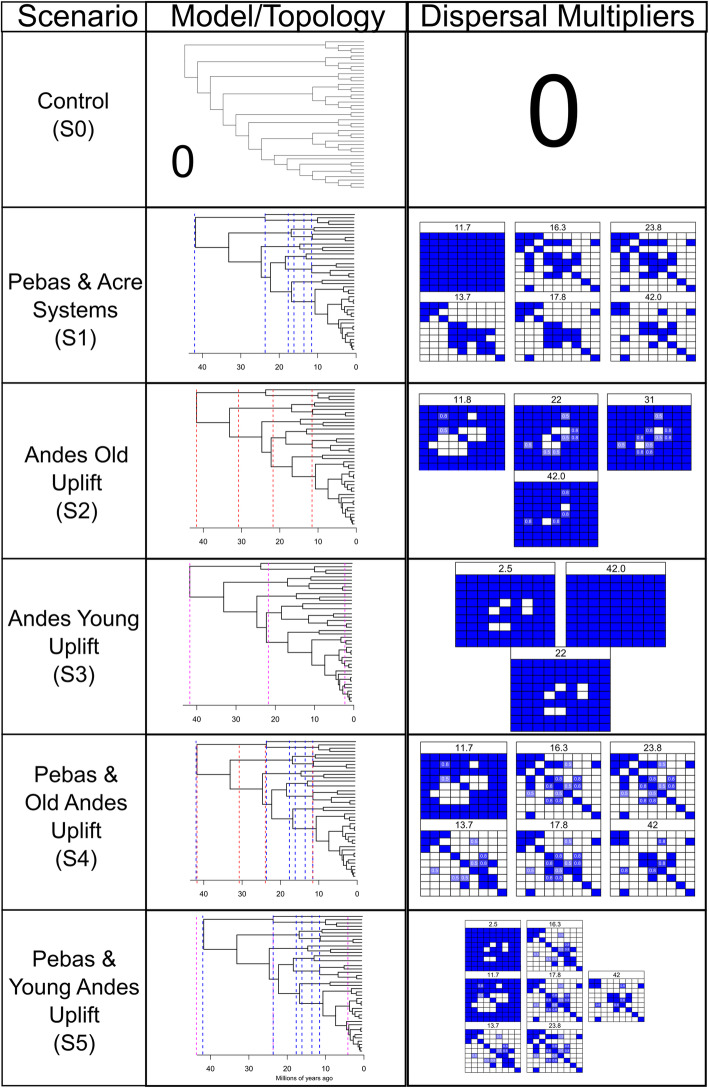
Fig. 2.
Designed Biogeographical Scenarios for the Ancestral Areas Reconstructions. All the five scenarios (S0-S5) tested in our biogeographical analyses using BioGeoBEARS accounting for the major geological events in South America. For each scenario, we show the tree topology model, time periods (i.e Millions of Years Ago) and dispersal multiplier matrices across all tested nine areas. The blue (1) to white (0) gradient represents the probability of dispersion across the areas. The Pebas and Acre Systems scenarios were designed using a combination of Hoorn et al. 2010 and Jaramillo et al. 2017, while for all Andes scenarios we used a combination of Hoorn et al. 2010 supplementary material and Gregory-Wodzicki 2000

