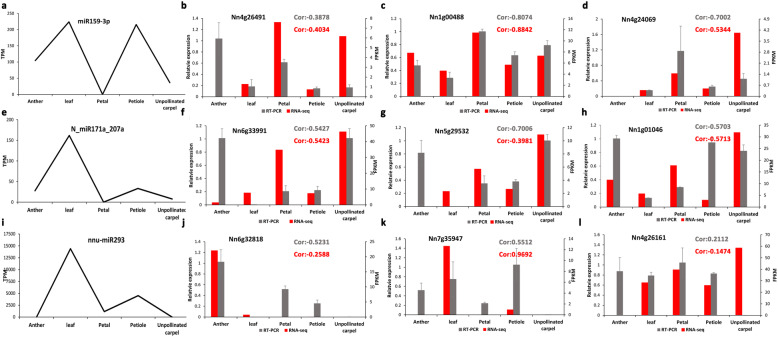
Fig. 3.
Expression profile of several selected miRNAs and targeted genes. The expression of miRNAs is shown in the line graph on the left column. The expression of the targeted gene is shown in the bar plot in the right three columns. The correlation coefficient between miRNA and the targeted gene is shown. Gray: RT-PCR result; red: RNA-seq result. The a-d figures show “miR159-3p” and its corresponding targeted gene. The e-h figures show “N_miR171a_207a” and its corresponding targeted gene. The i-l figures show “nnu-miR293” and its corresponding targeted gene

