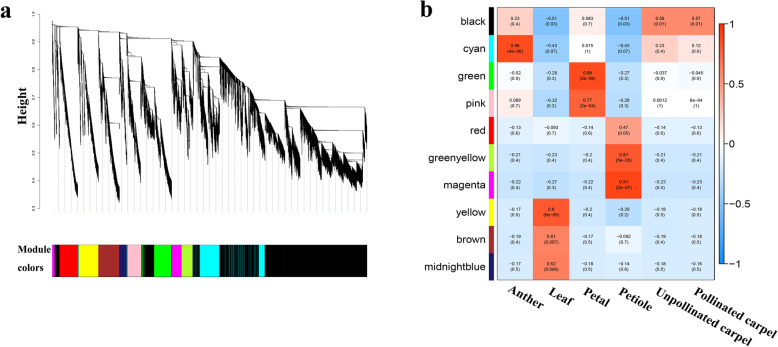
Fig. 4.
The co-expression network of filtered isoforms. a. Hierarchical cluster tree and color bands indicating 9 modules identified by weighted isoforms co-expression network analysis. b. The analysis of module-trait correlation. Each row represents a module and each column represents a specific sample. Each cell at the row-column intersection is color-coded by correlation according to the color legend. Each cell has two values: the up value is the correlation coefficient between the module genes and sample; the down value is the p-value

