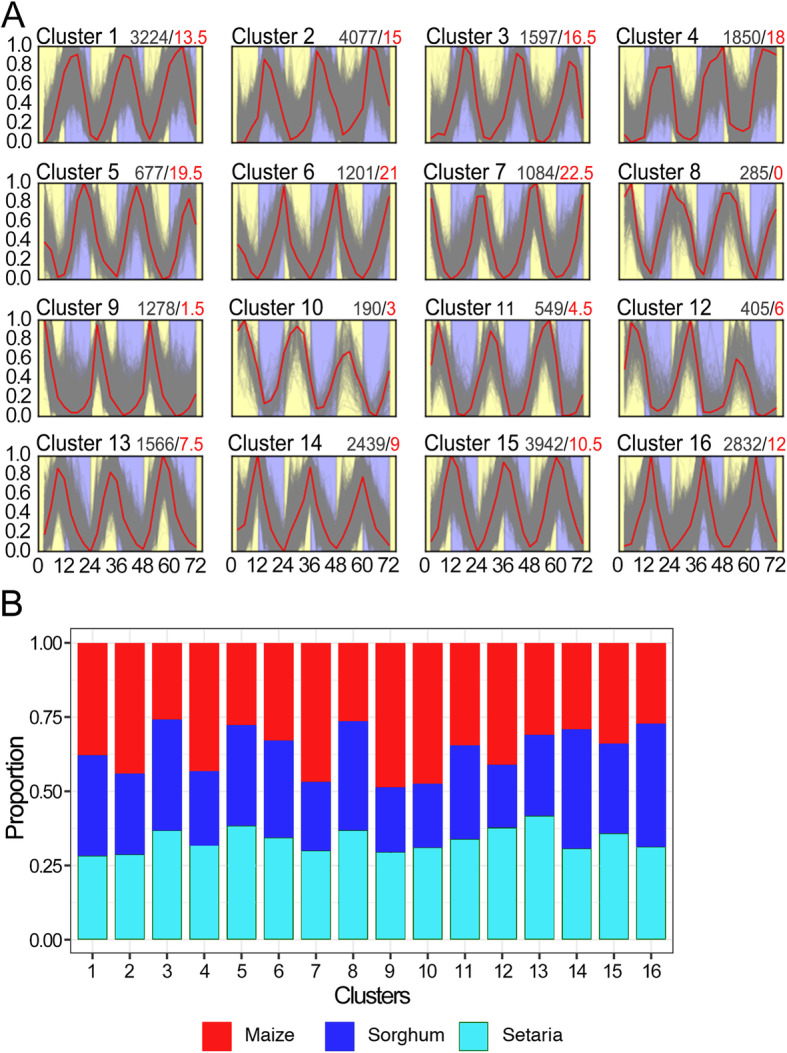
Fig. 2.

Diurnal co-expression clusters for orthologous syntenic sorghum, maize, and foxtail millet genes. a Normalized gene expression values show the diurnal expression pattern in 16 clusters derived from K-means clustering. b Proportion of genes from maize (red), sorghum (dark blue), and foxtail millet (light blue) in each of the 16 clusters. In (a), x-axis shows the time points and y-axis shows the 0–1 scaled FPKM values for each gene. Yellow and blue areas represent light and dark periods, respectively. Heavy red line is the median expression pattern of genes in that cluster and fine grey lines are individual genes. The total number of genes and median phase (in CT) of each cluster are show at the top of each panel as: total gene number/median phase (in red text)
