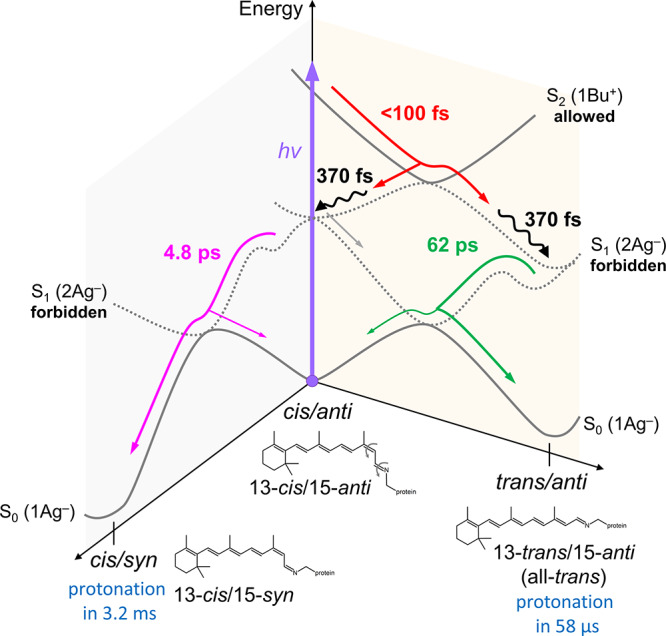
Figure 3.

Excited-state reaction model of Rh-UV HKR1. The red arrow indicates the isomerization pathway on the S2–S1 surfaces, including a reactive fraction to 13-trans/15-anti (all-trans) and a nonreactive fraction back to 13-cis/15-anti. The magenta arrow indicates the isomerization pathways on the S1–S0 surfaces from 13-cis/15-anti to 13-cis/15-syn. The wiggly black lines indicate vibrational cooling on the S1 potential energy surface. The green arrow indicates internal conversion from the S1 to the S0 state while maintaining the 13-trans/15-anti isomeric state.
