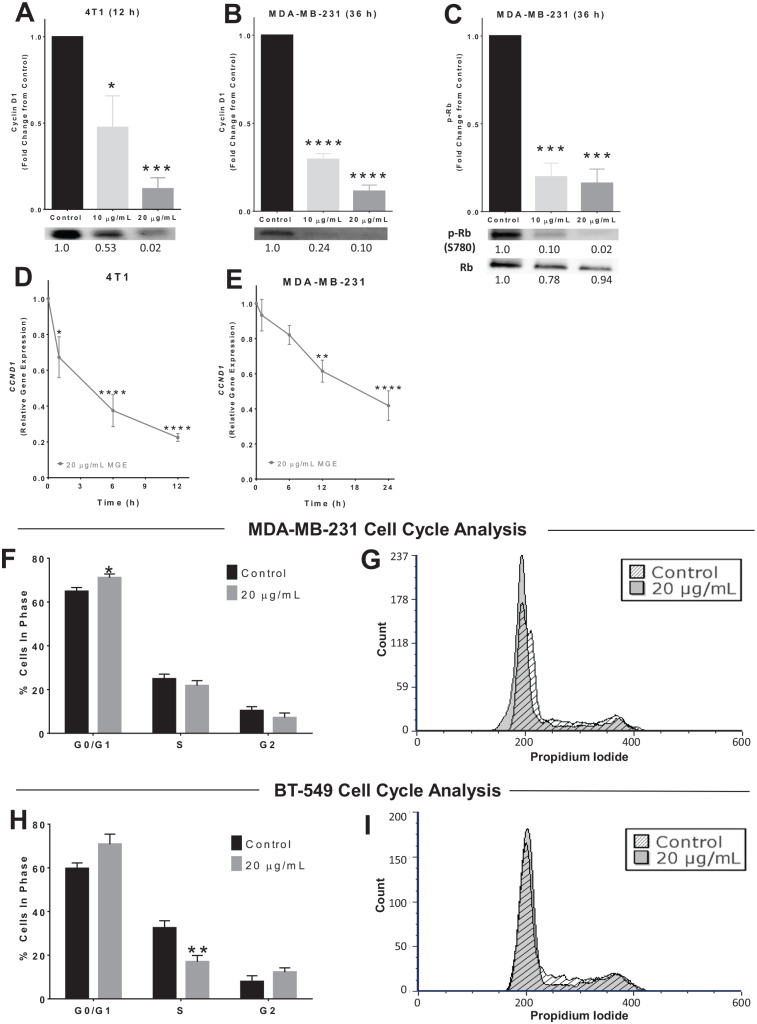
Figure 6.
Muscadine grape extract (MGE) reduces cyclin D1, Rb, and cell cycle progression. 4T1 (A) or MDA-MB-231 (B) cells were treated with either 10 µg phenolics/mL or 20 µg phenolics/mL of MGE for 12 or 36 hours, as indicated, and cyclin D1 was measured by western blot. Representative blots for cyclin D1 protein are shown below the quantitative graphs, and the relative fold-change in band intensity compared with control is shown below western blot bands. 4T1 (D) or MDA-MB-231 (E) cells were treated with 20 µg phenolics/mL of MGE for 1, 6, 12, or 24 hours, and CCND1, the gene that encodes cyclin D1, was measured by quantitative real-time polymerase chain reaction (qRT-PCR). (C) MDA-MB-231 cells were treated with 10 µg phenolics/mL or 20 µg phenolics/mL of MGE for 36 hours, and phosphorylation of Rb at S780 (p-Rb) and total Rb protein were measured by western blot. p-Rb was normalized to total Rb protein. Representative bands are shown below the quantitative graph, and the relative fold-change in band intensity compared with the control is shown below the western blot bands. For cell cycle analysis, MDA-MB-231 (F and G) and BT-549 (H and I) cells were treated with 20 µg phenolics/mL of MGE for 24 hours. The bar graphs indicate the percentage of cells in each phase of the cell cycle for untreated control cells compared with MGE-treated cells (F and H). Histograms of representative samples show the amount of propidium iodide staining within cells on the x-axis and the number of cells on the y-axis (count), with the peak at 200 indicating G0/G1 phase, the peak at 400 indicating G2 phase, and cells with levels of propidium iodide in between the peaks representative of S phase (G and I). Histograms of control (diagonal lines) and MGE-treated (shaded) cells were overlaid and normalized by total cell count. n = 3 to 5; *P < .05, **P < .01, ***P < .001, and ****P < .0001.

