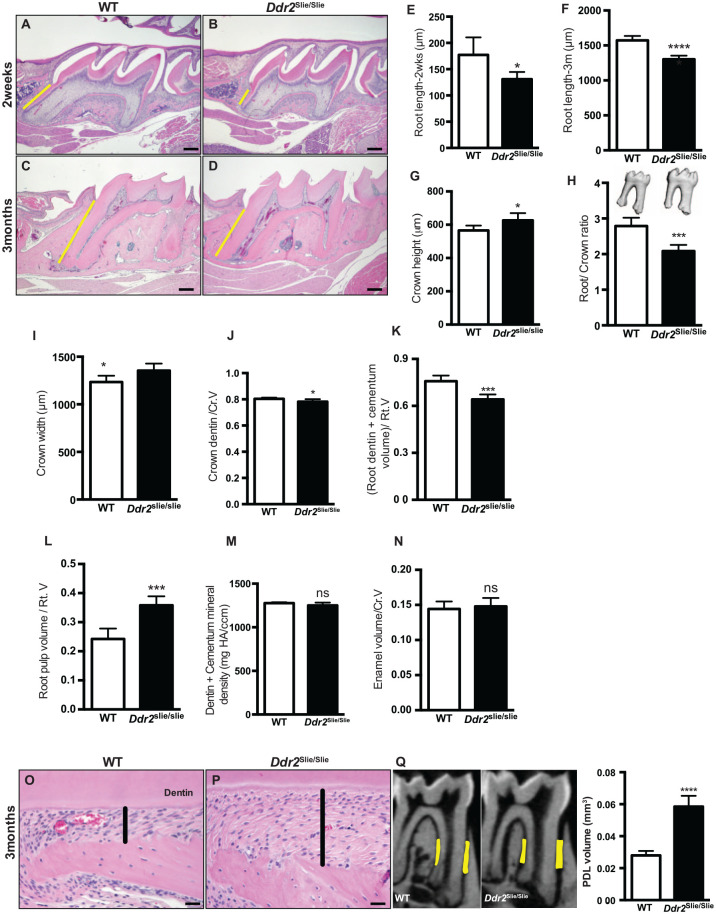
Figure 2.
Tooth and periodontal phenotypes in Ddr2-deficient mice. (A–D) Representative hematoxylin and eosin (H&E) staining of first molars showing delayed root formation (yellow lines) in developing (A, B) and adult teeth (C, D) compared with wild-type (WT). (E, F) Quantification of the molar root length at 2 wk and 3 mo of age. (G–I) Quantification of the crown height, root/crown ratio, and crown width in 3-mo-old mice. (J–N) Quantification of the crown dentin volume/total crown volume (Cr.V), root dentin + cementum volume/total root volume (Rt.V), root pulp volume/(Rt.V), dentin + cementum mineral density, and enamel volume/(Cr.V). (O, P) H&E staining shows wide periodontal ligament (PDL) spacing (highlighted in black lines) in Ddr2slie/slie mice compared with WT. (Q) Micro–computed tomography (CT) analysis of PDL spacing in WT and Ddr2slie/slie mice. Region of interest is shown in yellow. Quantitation of micro-CT data (right). *P < 0.05. ***P < 0.001. ****P < 0.0001. ns, not significant. n = 5–7 mice/group. Scale bar: 50 µm in A, B; 200 µm in C, D; 20 µm in O, P.

