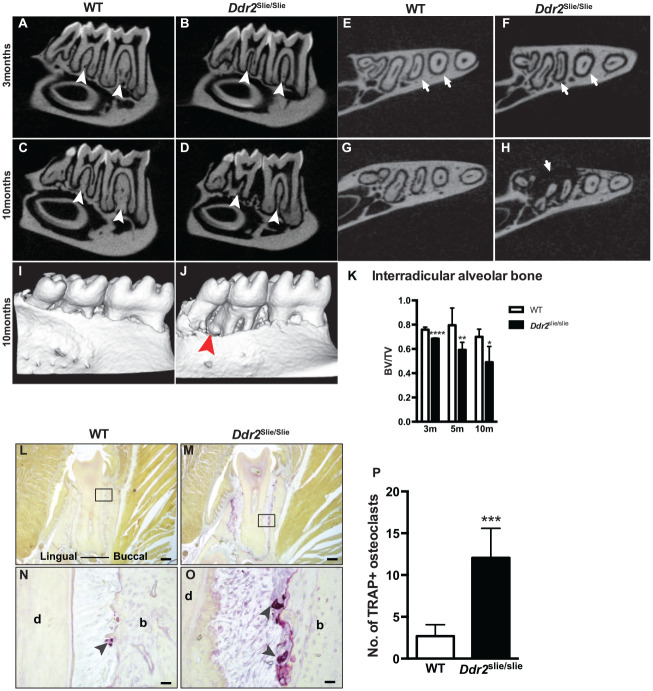
Figure 4.
Progressive alveolar bone loss in Ddr2 knockout. (A–H) Representative micro–computed tomography (CT) images showing thin interradicular alveolar bone (white arrowheads) and wide periodontal ligament (PDL) spacing (white arrows) in Ddr2slie/slie mice at 3 mo (B, F) and 10 mo (D, H) of age compared with wild-type (WT). (I, J) Three-dimensional reconstruction of the lower jaw section showing severe bone defects (J, red arrowhead) around lower teeth at 10 mo of age. (K) Micro-CT analysis of bone volume/total volume of interradicular alveolar bone of first and second molars (n = 5–7 mice/group). (L–O) Representative tartrate-resistant acid phosphatase (TRAP) staining images showing osteoclasts (purple color, arrowheads in N–O) along the alveolar bone surface at 10 mo of age. (P) Shows quantification of osteoclast numbers on frontal sections of the second molar alveolar bone (n = 4 mice). *P < 0.05. **P < 0.01. ***P < 0.001. ****P < 0.0001. Scale bar: 200 µm in L, M; 20 µm in N, O.

