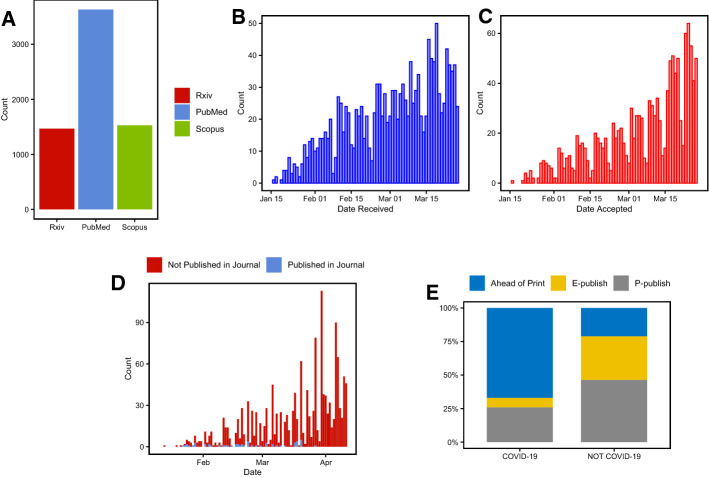
Fig. 1.
a The number of Rxiv, PubMed and Scopus articles on COVID-19. b Histogram portraying the number of COVID-19 articles per submission date (data only for accepted articles). c Histogram portraying a number of accepted COVID-19 articles per acceptance date in a journal. d Histogram portraying the number of articles published each day in BioRxiv and MedRxiv. Color indicates whether the article was published in a journal. e Publications status for COVID-19 articles and other articles from the same journal during 2020. (Color figure online)

